

Development and Globalization: - Unctad
Development and Globalization: - Unctad
Development and Globalization: - Unctad

You also want an ePaper? Increase the reach of your titles
YUMPU automatically turns print PDFs into web optimized ePapers that Google loves.
1 200<br />
1 000<br />
800<br />
600<br />
400<br />
200<br />
0<br />
-200<br />
Region<br />
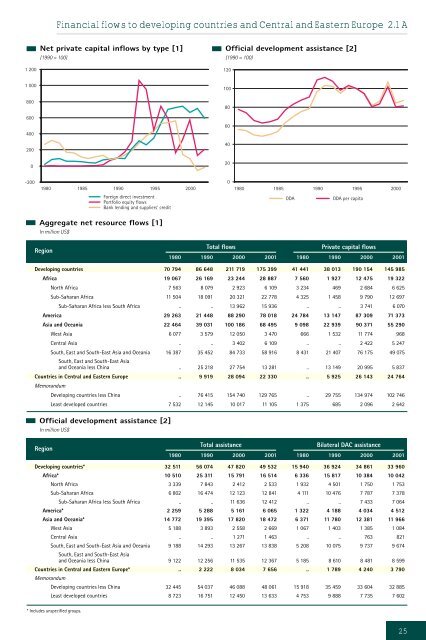
Financial flows to developing countries <strong>and</strong> Central <strong>and</strong> Eastern Europe 2.1 A<br />
Net private capital inflows by type [1]<br />
(1990 = 100)<br />
1980 1985 1990 1995 2000<br />
Region<br />
Foreign direct investment<br />
Portfolio equity flows<br />
Bank lending <strong>and</strong> suppliers' credit<br />
Aggregate net resource flows [1]<br />
In million US$<br />
Official development assistance [2]<br />
In million US$<br />
Official development assistance [2]<br />
(1990 = 100)<br />
0<br />
1980 1985 1990 1995 2000<br />
Total assistance Bilateral DAC assistance<br />
1980 1990 2000 2001 1980 1990 2000 2001<br />
Developing countries* 32 511 56 074 47 820 49 532 15 940 36 924 34 861 33 960<br />
Africa* 10 510 25 311 15 791 16 514 6 336 15 817 10 384 10 042<br />
North Africa 3 339 7 843 2 412 2 533 1 932 4 501 1 750 1 753<br />
Sub-Saharan Africa 6 802 16 474 12 123 12 841 4 111 10 476 7 787 7 378<br />
Sub-Saharan Africa less South Africa .. .. 11 636 12 412 .. .. 7 433 7 064<br />
America* 2 259 5 288 5 161 6 065 1 322 4 188 4 034 4 512<br />
Asia <strong>and</strong> Oceania* 14 772 19 395 17 820 18 472 6 371 11 780 12 381 11 966<br />
West Asia 5 188 3 893 2 558 2 669 1 067 1 403 1 385 1 084<br />
Central Asia .. .. 1 271 1 463 .. .. 763 821<br />
South, East <strong>and</strong> South-East Asia <strong>and</strong> Oceania<br />
South, East <strong>and</strong> South-East Asia<br />
9 188 14 293 13 267 13 838 5 208 10 075 9 737 9 674<br />
<strong>and</strong> Oceania less China 9 122 12 256 11 535 12 367 5 185 8 610 8 481 8 599<br />
Countries in Central <strong>and</strong> Eastern Europe*<br />
Memor<strong>and</strong>um<br />
.. 2 222 8 034 7 656 .. 1 789 4 240 3 790<br />
Developing countries less China 32 445 54 037 46 088 48 061 15 918 35 459 33 604 32 885<br />
Least developed countries 8 723 16 751 12 450 13 633 4 753 9 888 7 735 7 602<br />
120<br />
100<br />
80<br />
60<br />
40<br />
20<br />
ODA ODA per capita<br />
Total flows Private capital flows<br />
1980 1990 2000 2001 1980 1990 2000 2001<br />
Developing countries 70 794 86 648 211 719 175 399 41 441 38 013 190 154 145 985<br />
Africa 19 067 26 169 23 244 28 887 7 560 1 927 12 475 19 322<br />
North Africa 7 563 8 079 2 923 6 109 3 234 469 2 684 6 625<br />
Sub-Saharan Africa 11 504 18 091 20 321 22 778 4 325 1 458 9 790 12 697<br />
Sub-Saharan Africa less South Africa .. .. 13 962 15 936 .. .. 3 741 6 070<br />
America 29 263 21 448 88 290 78 018 24 784 13 147 87 309 71 373<br />
Asia <strong>and</strong> Oceania 22 464 39 031 100 186 68 495 9 098 22 939 90 371 55 290<br />
West Asia 6 077 3 579 12 050 3 470 666 1 532 11 774 968<br />
Central Asia .. .. 3 402 6 109 .. .. 2 422 5 247<br />
South, East <strong>and</strong> South-East Asia <strong>and</strong> Oceania<br />
South, East <strong>and</strong> South-East Asia<br />
16 387 35 452 84 733 58 916 8 431 21 407 76 175 49 075<br />
<strong>and</strong> Oceania less China .. 25 218 27 754 13 281 .. 13 149 20 995 5 837<br />
Countries in Central <strong>and</strong> Eastern Europe<br />
Memor<strong>and</strong>um<br />
.. 9 919 28 094 22 330 .. 5 925 26 143 24 764<br />
Developing countries less China .. 76 415 154 740 129 765 .. 29 755 134 974 102 746<br />
Least developed countries 7 532 12 145 10 017 11 105 1 375 685 2 096 2 642<br />
* Includes unspecified groups.<br />
25


