

Development and Globalization: - Unctad
Development and Globalization: - Unctad
Development and Globalization: - Unctad

You also want an ePaper? Increase the reach of your titles
YUMPU automatically turns print PDFs into web optimized ePapers that Google loves.
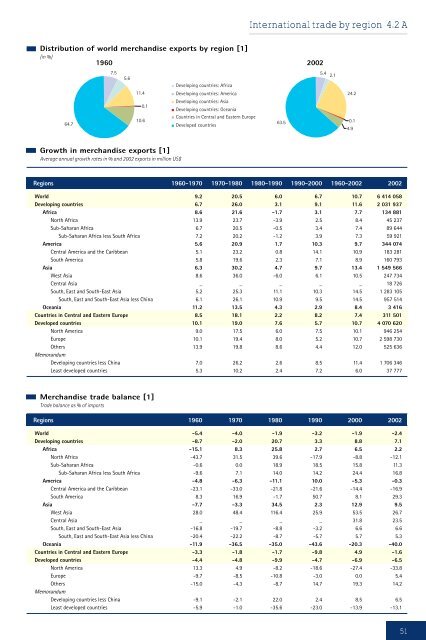
Distribution of world merch<strong>and</strong>ise exports by region [1]<br />
(in %)<br />
1960 2002<br />
64.7<br />
7.5<br />
5.6<br />
11.4<br />
0.1<br />
10.6<br />
Growth in merch<strong>and</strong>ise exports [1]<br />
Average annual growth rates in % <strong>and</strong> 2002 exports in million US$<br />
Developing countries: Africa<br />
Developing countries: America<br />
Developing countries: Asia<br />
Developing countries: Oceania<br />
Countries in Central <strong>and</strong> Eastern Europe<br />
Developed countries<br />
International trade by region 4.2 A<br />
Regions 1960-1970 1970-1980 1980-1990 1990-2000 1960-2002 2002<br />
World 9.2 20.5 6.0 6.7 10.7 6 414 058<br />
Developing countries 6.7 26.0 3.1 9.1 11.6 2 031 937<br />
Africa 8.6 21.6 -1.7 3.1 7.7 134 881<br />
North Africa 13.9 23.7 -3.9 2.5 8.4 45 237<br />
Sub-Saharan Africa 6.7 20.5 -0.5 3.4 7.4 89 644<br />
Sub-Saharan Africa less South Africa 7.2 20.2 -1.2 3.9 7.3 59 921<br />
America 5.6 20.9 1.7 10.3 9.7 344 074<br />
Central America <strong>and</strong> the Caribbean 5.1 23.2 0.8 14.1 10.9 183 281<br />
South America 5.8 19.6 2.3 7.1 8.9 160 793<br />
Asia 6.3 30.2 4.7 9.7 13.4 1 549 566<br />
West Asia 8.6 36.0 -6.0 6.1 10.5 247 734<br />
Central Asia _ _ _ _ _ 18 726<br />
South, East <strong>and</strong> South-East Asia 5.2 25.3 11.1 10.3 14.5 1 283 105<br />
South, East <strong>and</strong> South-East Asia less China 6.1 26.1 10.9 9.5 14.5 957 514<br />
Oceania 11.2 13.5 4.3 2.9 8.4 3 416<br />
Countries in Central <strong>and</strong> Eastern Europe 8.5 18.1 2.2 8.2 7.4 311 501<br />
Developed countries 10.1 19.0 7.6 5.7 10.7 4 070 620<br />
North America 9.0 17.5 6.0 7.5 10.1 946 254<br />
Europe 10.1 19.4 8.0 5.2 10.7 2 598 730<br />
Others 13.9 19.8 8.6 4.4 12.0 525 636<br />
Memor<strong>and</strong>um<br />
Developing countries less China 7.0 26.2 2.6 8.5 11.4 1 706 346<br />
Least developed countries 5.3 10.2 2.4 7.2 6.0 37 777<br />
Merch<strong>and</strong>ise trade balance [1]<br />
Trade balance as % of imports<br />
Regions 1960 1970 1980 1990 2000 2002<br />
World -5.4 -4.0 -1.9 -3.2 -1.9 -2.4<br />
Developing countries -8.7 -2.0 20.7 3.3 8.8 7.1<br />
Africa -15.1 8.3 25.8 2.7 6.5 2.2<br />
North Africa -43.7 31.5 39.6 -17.9 -8.8 -12.1<br />
Sub-Saharan Africa -0.6 0.0 18.9 18.5 15.8 11.3<br />
Sub-Saharan Africa less South Africa -9.6 7.1 14.0 14.2 24.4 16.8<br />
America -4.8 -6.3 -11.1 10.0 -5.3 -0.3<br />
Central America <strong>and</strong> the Caribbean -23.1 -33.0 -21.8 -21.6 -14.4 -16.9<br />
South America 8.3 16.9 -1.7 50.7 8.1 29.3<br />
Asia -7.7 -3.3 34.5 2.3 12.9 9.5<br />
West Asia 28.0 48.4 116.4 25.9 53.5 26.7<br />
Central Asia _ _ _ _ 31.8 23.5<br />
South, East <strong>and</strong> South-East Asia -16.8 -19.7 -8.8 -3.2 6.6 6.6<br />
South, East <strong>and</strong> South-East Asia less China -20.4 -22.2 -8.7 -5.7 5.7 5.3<br />
Oceania -11.9 -36.5 -35.0 -43.6 -20.3 -40.0<br />
Countries in Central <strong>and</strong> Eastern Europe -3.3 -1.8 -1.7 -9.8 4.9 -1.6<br />
Developed countries -4.4 -4.8 -9.9 -4.7 -6.9 -6.5<br />
North America 13.3 4.9 -8.2 -18.6 -27.4 -33.8<br />
Europe -9.7 -8.5 -10.8 -3.0 0.0 5.4<br />
Others -15.0 -4.3 -8.7 14.7 19.3 14.2<br />
Memor<strong>and</strong>um<br />
Developing countries less China -9.1 -2.1 22.0 2.4 8.5 6.5<br />
Least developed countries -5.9 -1.0 -35.6 -23.0 -13.9 -13.1<br />
63.5<br />
5.4 2.1<br />
24.2<br />
0.1<br />
4.9<br />
51


