

Development and Globalization: - Unctad
Development and Globalization: - Unctad
Development and Globalization: - Unctad

Create successful ePaper yourself
Turn your PDF publications into a flip-book with our unique Google optimized e-Paper software.
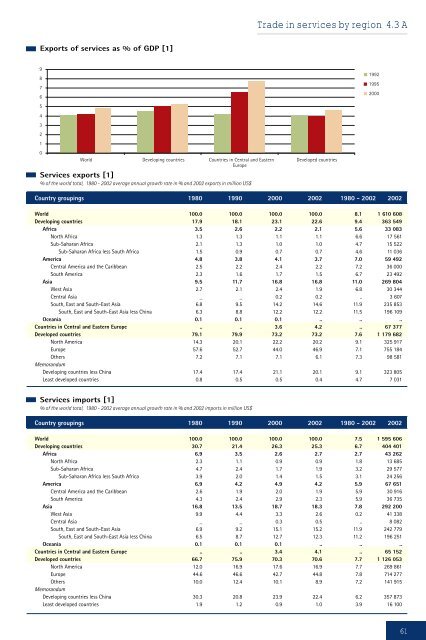
Exports of services as % of GDP [1]<br />
9<br />
8<br />
7<br />
6<br />
5<br />
4<br />
3<br />
2<br />
1<br />
0<br />
World<br />
Services exports [1]<br />
Developing countries Countries in Central <strong>and</strong> Eastern<br />
Europe<br />
% of the world total, 1980 - 2002 average annual growth rate in % <strong>and</strong> 2002 exports in million US$<br />
Trade in services by region 4.3 A<br />
Developed countries<br />
Country groupings 1980 1990 2000 2002 1980 - 2002 2002<br />
World 100.0 100.0 100.0 100.0 8.1 1 610 608<br />
Developing countries 17.9 18.1 23.1 22.6 9.4 363 549<br />
Africa 3.5 2.6 2.2 2.1 5.6 33 083<br />
North Africa 1.3 1.3 1.1 1.1 6.6 17 561<br />
Sub-Saharan Africa 2.1 1.3 1.0 1.0 4.7 15 522<br />
Sub-Saharan Africa less South Africa 1.5 0.9 0.7 0.7 4.6 11 036<br />
America 4.8 3.8 4.1 3.7 7.0 59 492<br />
Central America <strong>and</strong> the Caribbean 2.5 2.2 2.4 2.2 7.2 36 000<br />
South America 2.3 1.6 1.7 1.5 6.7 23 492<br />
Asia 9.5 11.7 16.8 16.8 11.0 269 804<br />
West Asia 2.7 2.1 2.4 1.9 6.8 30 344<br />
Central Asia _ _ 0.2 0.2 .. 3 607<br />
South, East <strong>and</strong> South-East Asia 6.8 9.5 14.2 14.6 11.9 235 853<br />
South, East <strong>and</strong> South-East Asia less China 6.3 8.8 12.2 12.2 11.5 196 109<br />
Oceania 0.1 0.1 0.1 .. .. ..<br />
Countries in Central <strong>and</strong> Eastern Europe .. .. 3.6 4.2 .. 67 377<br />
Developed countries 79.1 79.9 73.2 73.2 7.6 1 179 682<br />
North America 14.3 20.1 22.2 20.2 9.1 325 917<br />
Europe 57.6 52.7 44.0 46.9 7.1 755 184<br />
Others 7.2 7.1 7.1 6.1 7.3 98 581<br />
Memor<strong>and</strong>um<br />
Developing countries less China 17.4 17.4 21.1 20.1 9.1 323 805<br />
Least developed countries 0.8 0.5 0.5 0.4 4.7 7 031<br />
Services imports [1]<br />
% of the world total, 1980 - 2002 average annual growth rate in % <strong>and</strong> 2002 imports in million US$<br />
Country groupings 1980 1990 2000 2002 1980 - 2002 2002<br />
World 100.0 100.0 100.0 100.0 7.5 1 595 606<br />
Developing countries 30.7 21.4 26.3 25.3 6.7 404 401<br />
Africa 6.9 3.5 2.6 2.7 2.7 43 262<br />
North Africa 2.3 1.1 0.9 0.9 1.8 13 685<br />
Sub-Saharan Africa 4.7 2.4 1.7 1.9 3.2 29 577<br />
Sub-Saharan Africa less South Africa 3.9 2.0 1.4 1.5 3.1 24 256<br />
America 6.9 4.2 4.9 4.2 5.9 67 651<br />
Central America <strong>and</strong> the Caribbean 2.6 1.9 2.0 1.9 5.9 30 916<br />
South America 4.3 2.4 2.9 2.3 5.9 36 735<br />
Asia 16.8 13.5 18.7 18.3 7.8 292 200<br />
West Asia 9.9 4.4 3.3 2.6 0.2 41 338<br />
Central Asia _ _ 0.3 0.5 .. 8 082<br />
South, East <strong>and</strong> South-East Asia 6.9 9.2 15.1 15.2 11.9 242 779<br />
South, East <strong>and</strong> South-East Asia less China 6.5 8.7 12.7 12.3 11.2 196 251<br />
Oceania 0.1 0.1 0.1 .. .. ..<br />
Countries in Central <strong>and</strong> Eastern Europe .. .. 3.4 4.1 .. 65 152<br />
Developed countries 66.7 75.9 70.3 70.6 7.7 1 126 053<br />
North America 12.0 16.9 17.6 16.9 7.7 269 861<br />
Europe 44.6 46.6 42.7 44.8 7.8 714 277<br />
Others 10.0 12.4 10.1 8.9 7.2 141 915<br />
Memor<strong>and</strong>um<br />
Developing countries less China 30.3 20.8 23.9 22.4 6.2 357 873<br />
Least developed countries 1.9 1.2 0.9 1.0 3.9 16 100<br />
1992<br />
1995<br />
2000<br />
61


