

Development and Globalization: - Unctad
Development and Globalization: - Unctad
Development and Globalization: - Unctad

Create successful ePaper yourself
Turn your PDF publications into a flip-book with our unique Google optimized e-Paper software.
9<br />
8<br />
7<br />
6<br />
5<br />
4<br />
3<br />
2<br />
1<br />
0<br />
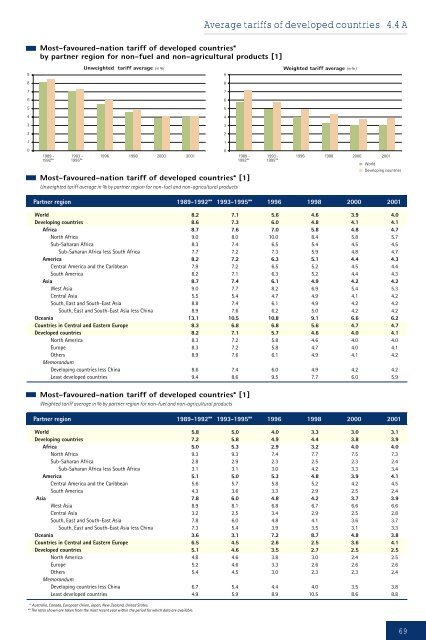
Most-favoured-nation tariff of developed countries*<br />
by partner region for non-fuel <strong>and</strong> non-agricultural products [1]<br />
1989 -<br />
1992**<br />
1993 -<br />
1995**<br />
Unweighted tariff average (in %)<br />
1996 1998 2000 2001<br />
Average tariffs of developed countries 4.4 A<br />
Partner region 1989-1992** 1993-1995** 1996 1998 2000 2001<br />
World 8.2 7.1 5.6 4.6 3.9 4.0<br />
Developing countries 8.6 7.3 6.0 4.8 4.1 4.1<br />
Africa 8.7 7.6 7.0 5.8 4.8 4.7<br />
North Africa 9.0 8.0 10.0 8.4 5.8 5.7<br />
Sub-Saharan Africa 8.3 7.4 6.5 5.4 4.5 4.5<br />
Sub-Saharan Africa less South Africa 7.7 7.2 7.3 5.9 4.8 4.7<br />
America 8.2 7.2 6.3 5.1 4.4 4.3<br />
Central America <strong>and</strong> the Caribbean 7.9 7.2 6.5 5.2 4.5 4.4<br />
South America 8.2 7.1 6.3 5.2 4.4 4.3<br />
Asia 8.7 7.4 6.1 4.9 4.2 4.2<br />
West Asia 9.0 7.7 8.2 6.9 5.4 5.3<br />
Central Asia 5.5 5.4 4.7 4.9 4.1 4.2<br />
South, East <strong>and</strong> South-East Asia 8.8 7.4 6.1 4.9 4.2 4.2<br />
South, East <strong>and</strong> South-East Asia less China 8.9 7.6 6.2 5.0 4.2 4.2<br />
Oceania 13.1 10.5 10.8 9.1 6.6 6.2<br />
Countries in Central <strong>and</strong> Eastern Europe 8.3 6.8 6.8 5.6 4.7 4.7<br />
Developed countries 8.2 7.1 5.7 4.6 4.0 4.1<br />
North America 8.3 7.2 5.8 4.6 4.0 4.0<br />
Europe 8.3 7.2 5.8 4.7 4.0 4.1<br />
Others 8.9 7.6 6.1 4.9 4.1 4.2<br />
Memor<strong>and</strong>um<br />
Developing countries less China 8.6 7.4 6.0 4.9 4.2 4.2<br />
Least developed countries 9.4 8.6 9.5 7.7 6.0 5.9<br />
9<br />
8<br />
7<br />
6<br />
5<br />
4<br />
3<br />
2<br />
1<br />
0<br />
1989 -<br />
1992**<br />
Most-favoured-nation tariff of developed countries* [1]<br />
Unweighted tariff average in % by partner region for non-fuel <strong>and</strong> non-agricultural products<br />
Most-favoured-nation tariff of developed countries* [1]<br />
Weighted tariff average in % by partner region for non-fuel <strong>and</strong> non-agricultural products<br />
1993 -<br />
1995**<br />
1996 1998 2000 2001<br />
World<br />
Developing countries<br />
Partner region 1989-1992** 1993-1995** 1996 1998 2000 2001<br />
World 5.8 5.0 4.0 3.3 3.0 3.1<br />
Developing countries 7.2 5.8 4.9 4.4 3.8 3.9<br />
Africa 5.0 5.3 2.9 3.2 4.0 4.0<br />
North Africa 9.3 9.3 7.4 7.7 7.5 7.3<br />
Sub-Saharan Africa 2.8 2.9 2.3 2.5 2.3 2.4<br />
Sub-Saharan Africa less South Africa 3.1 3.1 3.0 4.2 3.3 3.4<br />
America 5.1 5.0 5.3 4.8 3.9 4.1<br />
Central America <strong>and</strong> the Caribbean 5.6 5.7 5.8 5.2 4.2 4.5<br />
South America 4.3 3.6 3.3 2.9 2.5 2.4<br />
Asia 7.8 6.0 4.8 4.2 3.7 3.9<br />
West Asia 8.9 8.1 6.8 6.7 6.6 6.6<br />
Central Asia 3.2 2.5 3.4 2.9 2.5 2.8<br />
South, East <strong>and</strong> South-East Asia 7.8 6.0 4.8 4.1 3.6 3.7<br />
South, East <strong>and</strong> South-East Asia less China 7.3 5.4 3.9 3.5 3.1 3.3<br />
Oceania 3.6 3.1 7.2 8.7 4.8 3.8<br />
Countries in Central <strong>and</strong> Eastern Europe 6.5 4.5 2.6 2.5 3.6 4.1<br />
Developed countries 5.1 4.6 3.5 2.7 2.5 2.5<br />
North America 4.8 4.6 3.8 3.0 2.4 2.5<br />
Europe 5.2 4.6 3.3 2.6 2.6 2.6<br />
Others 5.4 4.5 3.0 2.3 2.3 2.4<br />
Memor<strong>and</strong>um<br />
Developing countries less China 6.7 5.4 4.4 4.0 3.5 3.8<br />
Least developed countries 4.9 5.9 8.9 10.5 8.6 8.8<br />
** Australia, Canada, European Union, Japan, New Zeal<strong>and</strong>, United States.<br />
** The rates shown are taken from the most recent year within the period for which data are available.<br />
Weighted tariff average (in % )<br />
69


