

Development and Globalization: - Unctad
Development and Globalization: - Unctad
Development and Globalization: - Unctad

You also want an ePaper? Increase the reach of your titles
YUMPU automatically turns print PDFs into web optimized ePapers that Google loves.
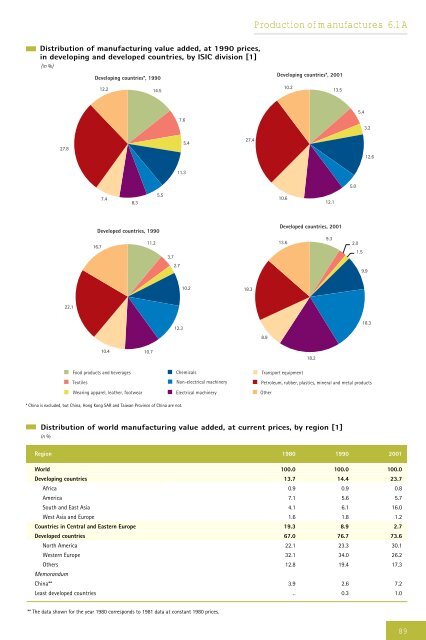
Distribution of manufacturing value added, at 1990 prices,<br />
in developing <strong>and</strong> developed countries, by ISIC division [1]<br />
(in %)<br />
27.8<br />
22.1<br />
Developing countries*, 1990<br />
16.7<br />
12.2<br />
7.4<br />
8.3<br />
14.5<br />
Developed countries, 1990<br />
10.4<br />
Food products <strong>and</strong> beverages<br />
Textiles<br />
Wearing apparel, leather, footwear<br />
11.2<br />
10.7<br />
5.5<br />
7.6<br />
11.3<br />
3.7<br />
2.7<br />
12.3<br />
* China is excluded, but China, Hong Kong SAR <strong>and</strong> Taiwan Province of China are not.<br />
5.4<br />
10.2<br />
Chemicals<br />
Non-electrical machinery<br />
Electrical machinery<br />
27.4<br />
18.3<br />
Production of manufactures 6.1 A<br />
8.9<br />
Developing countries*, 2001<br />
10.6<br />
10.2<br />
12.1<br />
13.5<br />
Developed countries, 2001<br />
13.6<br />
Transport equipment<br />
18.2<br />
9.3<br />
5.0<br />
5.4<br />
2.0<br />
1.5<br />
3.2<br />
9.9<br />
12.6<br />
18.3<br />
Petroleum, rubber, plastics, mineral <strong>and</strong> metal products<br />
Distribution of world manufacturing value added, at current prices, by region [1]<br />
In %<br />
Region 1980 1990 2001<br />
World 100.0 100.0 100.0<br />
Developing countries 13.7 14.4 23.7<br />
Africa 0.9 0.9 0.8<br />
America 7.1 5.6 5.7<br />
South <strong>and</strong> East Asia 4.1 6.1 16.0<br />
West Asia <strong>and</strong> Europe 1.6 1.8 1.2<br />
Countries in Central <strong>and</strong> Eastern Europe 19.3 8.9 2.7<br />
Developed countries 67.0 76.7 73.6<br />
North America 22.1 23.3 30.1<br />
Western Europe 32.1 34.0 26.2<br />
Others<br />
Memor<strong>and</strong>um<br />
12.8 19.4 17.3<br />
China** 3.9 2.6 7.2<br />
Least developed countries .. 0.3 1.0<br />
** The data shown for the year 1980 corresponds to 1981 data at constant 1980 prices.<br />
Other<br />
89


