

Development and Globalization: - Unctad
Development and Globalization: - Unctad
Development and Globalization: - Unctad

Create successful ePaper yourself
Turn your PDF publications into a flip-book with our unique Google optimized e-Paper software.
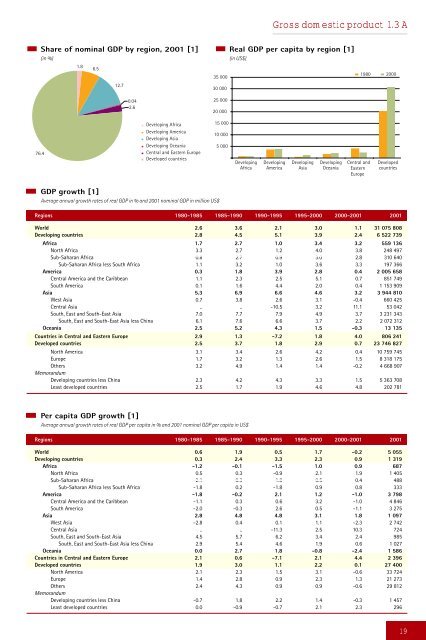
Share of nominal GDP by region, 2001 [1]<br />
(in %)<br />
76.4<br />
1.8<br />
6.5<br />
12.7<br />
0.04<br />
2.6<br />
Developing Africa<br />
Developing America<br />
Developing Asia<br />
Developing Oceania<br />
Central <strong>and</strong> Eastern Europe<br />
Developed countries<br />
GDP growth [1]<br />
Average annual growth rates of real GDP in % <strong>and</strong> 2001 nominal GDP in million US$<br />
35 000<br />
30 000<br />
25 000<br />
20 000<br />
15 000<br />
10 000<br />
5 000<br />
Developing<br />
Africa<br />
Gross domestic product 1.3 A<br />
Real GDP per capita by region [1]<br />
(in US$)<br />
Developing<br />
America<br />
Developing<br />
Asia<br />
Developing<br />
Oceania<br />
Central <strong>and</strong><br />
Eastern<br />
Europe<br />
1980 2000<br />
Developed<br />
countries<br />
Regions 1980-1985 1985-1990 1990-1995 1995-2000 2000-2001 2001<br />
World 2.6 3.6 2.1 3.0 1.1 31 075 808<br />
Developing countries 2.8 4.5 5.1 3.9 2.4 6 522 739<br />
Africa 1.7 2.7 1.0 3.4 3.2 559 136<br />
North Africa 3.3 2.7 1.2 4.0 3.8 248 497<br />
Sub-Saharan Africa 0.8 2.7 0.9 3.0 2.8 310 640<br />
Sub-Saharan Africa less South Africa 1.1 3.2 1.0 3.6 3.3 197 366<br />
America 0.3 1.8 3.9 2.8 0.4 2 005 658<br />
Central America <strong>and</strong> the Caribbean 1.1 2.3 2.5 5.1 0.7 851 749<br />
South America 0.1 1.6 4.4 2.0 0.4 1 153 909<br />
Asia 5.3 6.9 6.6 4.6 3.2 3 944 810<br />
West Asia 0.7 3.8 2.6 3.1 -0.4 660 425<br />
Central Asia .. .. -10.5 3.2 11.1 53 042<br />
South, East <strong>and</strong> South-East Asia 7.0 7.7 7.9 4.9 3.7 3 231 343<br />
South, East <strong>and</strong> South-East Asia less China 6.1 7.6 6.6 3.7 2.2 2 072 312<br />
Oceania 2.5 5.2 4.3 1.5 -0.3 13 135<br />
Countries in Central <strong>and</strong> Eastern Europe 2.9 1.3 -7.2 1.8 4.0 806 241<br />
Developed countries 2.5 3.7 1.8 2.9 0.7 23 746 827<br />
North America 3.1 3.4 2.6 4.2 0.4 10 759 745<br />
Europe 1.7 3.2 1.3 2.6 1.5 8 318 175<br />
Others<br />
Memor<strong>and</strong>um<br />
3.2 4.9 1.4 1.4 -0.2 4 668 907<br />
Developing countries less China 2.3 4.2 4.3 3.3 1.5 5 363 708<br />
Least developed countries 2.5 1.7 1.9 4.6 4.8 202 781<br />
Per capita GDP growth [1]<br />
Average annual growth rates of real GDP per capita in % <strong>and</strong> 2001 nominal GDP per capita in US$<br />
Regions 1980-1985 1985-1990 1990-1995 1995-2000 2000-2001 2001<br />
World 0.6 1.9 0.5 1.7 -0.2 5 055<br />
Developing countries 0.3 2.4 3.3 2.3 0.9 1 319<br />
Africa -1.2 -0.1 -1.5 1.0 0.9 687<br />
North Africa 0.5 0.3 -0.9 2.1 1.9 1 405<br />
Sub-Saharan Africa -2.1 -0.3 -1.8 0.5 0.4 488<br />
Sub-Saharan Africa less South Africa -1.8 0.2 -1.8 0.9 0.8 333<br />
America -1.8 -0.2 2.1 1.2 -1.0 3 798<br />
Central America <strong>and</strong> the Caribbean -1.1 0.3 0.6 3.2 -1.0 4 846<br />
South America -2.0 -0.3 2.6 0.5 -1.1 3 275<br />
Asia 2.8 4.8 4.8 3.1 1.8 1 097<br />
West Asia -2.8 0.4 0.1 1.1 -2.3 2 742<br />
Central Asia .. .. -11.3 2.5 10.3 724<br />
South, East <strong>and</strong> South-East Asia 4.5 5.7 6.2 3.4 2.4 985<br />
South, East <strong>and</strong> South-East Asia less China 2.9 5.4 4.6 1.9 0.6 1 027<br />
Oceania 0.0 2.7 1.8 -0.8 -2.4 1 586<br />
Countries in Central <strong>and</strong> Eastern Europe 2.1 0.6 -7.1 2.1 4.4 2 396<br />
Developed countries 1.9 3.0 1.1 2.2 0.1 27 400<br />
North America 2.1 2.3 1.5 3.1 -0.6 33 724<br />
Europe 1.4 2.8 0.9 2.3 1.3 21 273<br />
Others 2.4 4.3 0.9 0.9 -0.6 29 812<br />
Memor<strong>and</strong>um<br />
Developing countries less China -0.7 1.8 2.2 1.4 -0.3 1 457<br />
Least developed countries 0.0 -0.9 -0.7 2.1 2.3 296<br />
19


