

Development and Globalization: - Unctad
Development and Globalization: - Unctad
Development and Globalization: - Unctad

You also want an ePaper? Increase the reach of your titles
YUMPU automatically turns print PDFs into web optimized ePapers that Google loves.
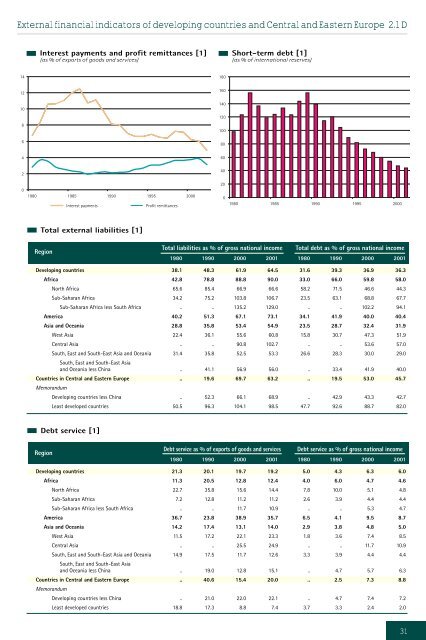
External financial indicators of developing countries <strong>and</strong> Central <strong>and</strong> Eastern Europe 2.1 D<br />
14<br />
12<br />
10<br />
8<br />
6<br />
4<br />
2<br />
Interest payments <strong>and</strong> profit remittances [1]<br />
(as % of exports of goods <strong>and</strong> services)<br />
0<br />
1980 1985 1990 1995 2000<br />
Region<br />
Interest payments Profit remittances<br />
Total external liabilities [1]<br />
Region<br />
Debt service [1]<br />
180<br />
160<br />
140<br />
120<br />
100<br />
80<br />
60<br />
40<br />
20<br />
Short-term debt [1]<br />
(as % of international reserves)<br />
0<br />
1980 1985 1990 1995 2000<br />
Total liabilities as % of gross national income Total debt as % of gross national income<br />
1980 1990 2000 2001 1980 1990 2000 2001<br />
Developing countries 38.1 48.3 61.9 64.5 31.6 39.3 36.9 36.3<br />
Africa 42.8 78.8 88.8 90.0 33.0 66.0 59.8 58.0<br />
North Africa 65.6 85.4 66.9 66.6 58.2 71.5 46.6 44.3<br />
Sub-Saharan Africa 34.2 75.2 103.8 106.7 23.5 63.1 68.8 67.7<br />
Sub-Saharan Africa less South Africa .. .. 135.2 129.0 .. .. 102.2 94.1<br />
America 40.2 51.3 67.1 73.1 34.1 41.9 40.0 40.4<br />
Asia <strong>and</strong> Oceania 28.8 35.8 53.4 54.9 23.5 28.7 32.4 31.9<br />
West Asia 22.4 36.1 55.6 60.8 15.8 30.7 47.3 51.9<br />
Central Asia .. .. 90.8 102.7 .. .. 53.6 57.0<br />
South, East <strong>and</strong> South-East Asia <strong>and</strong> Oceania<br />
South, East <strong>and</strong> South-East Asia<br />
31.4 35.8 52.5 53.3 26.6 28.3 30.0 29.0<br />
<strong>and</strong> Oceania less China .. 41.1 56.9 56.0 .. 33.4 41.9 40.0<br />
Countries in Central <strong>and</strong> Eastern Europe<br />
Memor<strong>and</strong>um<br />
.. 19.6 69.7 63.2 .. 19.5 53.0 45.7<br />
Developing countries less China .. 52.3 66.1 68.9 .. 42.9 43.3 42.7<br />
Least developed countries 50.5 96.3 104.1 98.5 47.7 92.6 88.7 82.0<br />
Debt service as % of exports of goods <strong>and</strong> services Debt service as % of gross national income<br />
1980 1990 2000 2001 1980 1990 2000 2001<br />
Developing countries 21.3 20.1 19.7 19.2 5.0 4.3 6.3 6.0<br />
Africa 11.3 20.5 12.8 12.4 4.0 6.0 4.7 4.6<br />
North Africa 22.7 35.8 15.6 14.4 7.8 10.0 5.1 4.8<br />
Sub-Saharan Africa 7.2 12.8 11.2 11.2 2.6 3.9 4.4 4.4<br />
Sub-Saharan Africa less South Africa .. .. 11.7 10.9 .. .. 5.3 4.7<br />
America 36.7 23.8 38.9 35.7 6.5 4.1 9.5 8.7<br />
Asia <strong>and</strong> Oceania 14.2 17.4 13.1 14.0 2.9 3.8 4.8 5.0<br />
West Asia 11.5 17.2 22.1 23.3 1.8 3.6 7.4 8.5<br />
Central Asia .. .. 25.5 24.9 .. .. 11.7 10.9<br />
South, East <strong>and</strong> South-East Asia <strong>and</strong> Oceania<br />
South, East <strong>and</strong> South-East Asia<br />
14.9 17.5 11.7 12.6 3.3 3.9 4.4 4.4<br />
<strong>and</strong> Oceania less China .. 19.0 12.8 15.1 .. 4.7 5.7 6.3<br />
Countries in Central <strong>and</strong> Eastern Europe<br />
Memor<strong>and</strong>um<br />
.. 40.6 15.4 20.0 .. 2.5 7.3 8.8<br />
Developing countries less China .. 21.0 22.0 22.1 .. 4.7 7.4 7.2<br />
Least developed countries 18.8 17.3 8.8 7.4 3.7 3.3 2.4 2.0<br />
31


