- Page 5 and 6:
SOMMAI REpage1. INTRODUCTION.......
- Page 7:
INTRODUCTION1. INTRODUCTION1.1 Cadr
- Page 11 and 12:
PORTRAIT DE LA COMMUNE2. PORTRAIT D
- Page 13 and 14:
PORTRAIT DE LA COMMUNE2.2 Contexte
- Page 15 and 16:
PORTRAIT DE LA COMMUNE- Pour permet
- Page 17 and 18:
POLITIQUE DE L’HABITAT3. POLITIQU
- Page 19 and 20:
POLITIQUE DE L'HABITATDensification
- Page 21 and 22:
POLITIQUE DE L'HABITAT3.2 Approche
- Page 23 and 24:
POLITIQUE DE L'HABITATCOMMENTAIRESM
- Page 25 and 26:
POLITIQUE DE L'HABITATCOMMENTAIRESC
- Page 27 and 28:
POLITIQUE DE L'HABITATOBJECTIFS SEC
- Page 29 and 30:
POLITIQUE DE L'HABITATCette situati
- Page 31 and 32:
POLITIQUE DE L'HABITAT3.2.6 F ayard
- Page 33 and 34:
POLITIQUE DE L'HABITAT3.2.7 Ecog ia
- Page 35 and 36:
POLITIQUE DE L'HABITAT3.2.8 R ic h
- Page 37:
POLITIQUE DE L'HABITAT3.2.9 Creuso
- Page 41 and 42:
POLITIQUE DES EQUIPEMENTS ET DES SE
- Page 43 and 44:
POLITIQUE DES EQUIPEMENTS ET DES SE
- Page 45 and 46:
POLITIQUE DES EQUIPEMENTS ET DES SE
- Page 49 and 50:
POLITIQUE DE L'ECONOMIE ET DE L'EMP
- Page 51 and 52:
POLITIQUE DE L'ECONOMIE ET DE L'EMP
- Page 53 and 54:
POLITIQUE DE L'ECONOMIE ET DE L'EMP
- Page 55 and 56:
POLITIQUE DE L'ECONOMIE ET DE L'EMP
- Page 57 and 58:
POLITIQUE DES ESPACES PUBLICS, DU P
- Page 59 and 60:
POLITIQUE DES ESPACES PUBLICS, DU P
- Page 61 and 62:
0 m 100 00 400 500Echelle 1/15'000J
- Page 63 and 64:
POLITIQUE DES ESPACES PUBLICS, DU P
- Page 65 and 66:
POLITIQUE DES ESPACES PUBLICS, DU P
- Page 67 and 68:
POLITIQUE DES ESPACES PUBLICS, DU P
- Page 69:
0 m 200 400 600 800Echelle 1/25'000
- Page 72 and 73:
Pour que cela se fasse dans une dé
- Page 74 and 75:
7.3 Nature en villeSITUATION / DIAG
- Page 76 and 77:
7.5 Corridors à fauneSITUATION / D
- Page 78 and 79:
Cette bande de terrain, située ent
- Page 81 and 82:
POLITIQUE DE L'ENVIRONNEMENT8. POLI
- Page 83 and 84:
POLITIQUE DE L'ENVIRONNEMENT> Infor
- Page 85 and 86:
POLITIQUE DE L'ENVIRONNEMENT8.4 Ray
- Page 87 and 88:
POLITIQUE DE L'ENVIRONNEMENT8.6 Ene
- Page 89:
0m 100 200 300 400 500 600 700Echel
- Page 92 and 93:
Hiérarchie du réseauLe concept di
- Page 94 and 95:
La desserte ferroviaire est complé
- Page 96 and 97:
200 400Echelle 1/12'500000000pério
- Page 98 and 99:
Rues de quartiersCh. H.-Saladinrue
- Page 100 and 101:
PRINCIPES DE MISE EN ŒUVREEtapesSc
- Page 102 and 103:
Réseau régional principalLe rése
- Page 104 and 105:
MESURES / COMMENTAIRESNouvelle jonc
- Page 106 and 107:
l'automobiliste comme le fait de pa
- Page 108 and 109:
9.3 Stati onn emen tSITUATION / DIA
- Page 110 and 111:
En ce qui concerne l'accès des él
- Page 112 and 113:
A plus long terme, d'autres pistes
- Page 114 and 115:
0 300 400 500Echelle 1/15'000Novemb
- Page 116 and 117:
envisager un point de croisementsup
- Page 118 and 119:
9.5 Rés e au cy cl abl ePROBLEMATI
- Page 120 and 121:
0 m 100 200 300 400 500Echelle 1/15
- Page 122 and 123:
116
- Page 124 and 125:
La hiérarchie du réseau routier e
- Page 126 and 127:
L es e n je ux loca uxVersoix à la
- Page 128 and 129:
La vitesse des véhiculesRelation e
- Page 130 and 131:
OBJECTIFSAssurer la continuité du
- Page 132 and 133:
1 0 . 3 . 3 L e co nfortSITUATION /
- Page 134 and 135:
OBJECTIFSDévelopper le réseau de
- Page 136 and 137:
1 0 . 3 . 5 L es espaces p u b l ic
- Page 138 and 139:
10.4 Mis e en œuvr e et pri orité
- Page 140 and 141:
- mettre en avant le côté positif
- Page 142 and 143:
DONNÉES DE BASELIEUXRÉSEAUX PIÉT
- Page 144 and 145:
138
- Page 146 and 147: PrioritésLa mise en œuvre des obj
- Page 148 and 149: 142
- Page 150 and 151: PROGRAMME DE MISE EN ŒUVREMESURES
- Page 152 and 153: PROGRAMME DE MISE EN ŒUVREARGANDOp
- Page 154 and 155: PROGRAMME DE MISE EN ŒUVREVERSOIX-
- Page 156 and 157: PROGRAMME DE MISE EN ŒUVRESOUS-SAI
- Page 158 and 159: PROGRAMME DE MISE EN ŒUVREECOGIAOp
- Page 160 and 161: PROGRAMME DE MISE EN ŒUVRE : FICHE
- Page 162 and 163: PROGRAMME DE MISE EN ŒUVRE : FICHE
- Page 164 and 165: PROGRAMME DE MISE EN ŒUVRE : FICHE
- Page 166 and 167: PROGRAMME DE MISE EN ŒUVRE : FICHE
- Page 168 and 169: PROGRAMME DE MISE EN ŒUVRE : FICHE
- Page 170 and 171: PROGRAMME DE MISE EN ŒUVRE : FICHE
- Page 172 and 173: PROGRAMME DE MISE EN ŒUVRE : FICHE
- Page 174 and 175: PROGRAMME DE MISE EN ŒUVRE : FICHE
- Page 176 and 177: PROGRAMME DE MISE EN ŒUVRE : FICHE
- Page 178 and 179: PROGRAMME DE MISE EN ŒUVRE : FICHE
- Page 181: SOMMAIREpage1. POTENTIEL A BATIR ..
- Page 184 and 185: ANNEXE 1Secteur de la gare (zone de
- Page 186 and 187: ANNEXE 24
- Page 188 and 189: ANNEXE 26
- Page 190 and 191: ANNEXE 28
- Page 192 and 193: ANNEXE 210
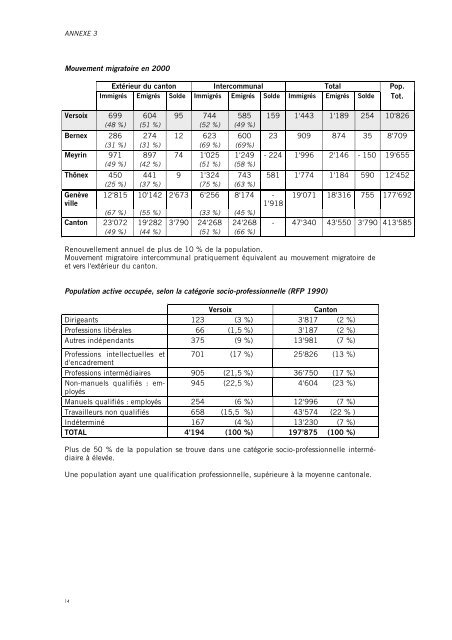
- Page 194 and 195: ANNEXE 3Population résidante de qu
- Page 198 and 199: ANNEXE 3Etablissements et emplois p
- Page 200 and 201: ANNEXE 33.3 Construction et logemen
- Page 202 and 203: ANNEXE 320
- Page 204 and 205: ANNEXE 4DECISIONSPar la présente r
- Page 206 and 207: ANNEXE 424
- Page 208 and 209: ANNEXE 5et pourraient passer à une
- Page 210 and 211: ANNEXE 528
- Page 212: ANNEXE 630