2011 - EnerPrev
2011 - EnerPrev
2011 - EnerPrev
- No tags were found...

Create successful ePaper yourself
Turn your PDF publications into a flip-book with our unique Google optimized e-Paper software.
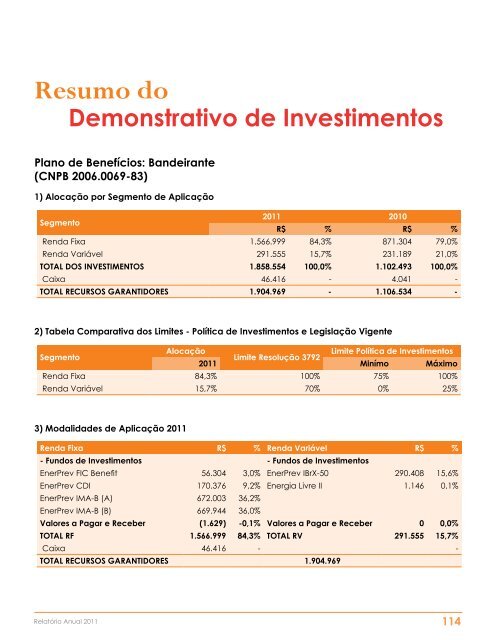
Resumo doDemonstrativo de InvestimentosPlano de Benefícios: Bandeirante(CNPB 2006.0069-83)1) Alocação por Segmento de AplicaçãoSegmento<strong>2011</strong> 2010R$ % R$ %Renda Fixa 1.566.999 84,3% 871.304 79,0%Renda Variável 291.555 15,7% 231.189 21,0%TOTAL DOS INVESTIMENTOS 1.858.554 100,0% 1.102.493 100,0%Caixa 46.416 - 4.041 -TOTAL RECURSOS GARANTIDORES 1.904.969 - 1.106.534 -2) Tabela Comparativa dos Limites - Política de Investimentos e Legislação VigenteSegmentoAlocaçãoLimite Política de InvestimentosLimite Resolução 3792<strong>2011</strong> Minímo MáximoRenda Fixa 84,3% 100% 75% 100%Renda Variável 15,7% 70% 0% 25%3) Modalidades de Aplicação <strong>2011</strong>Renda Fixa R$ % Renda Variável R$ %- Fundos de Investimentos - Fundos de Investimentos<strong>EnerPrev</strong> FIC Benefit 56.304 3,0% <strong>EnerPrev</strong> IBrX-50 290.408 15,6%<strong>EnerPrev</strong> CDI 170.376 9,2% Energia Livre II 1.146 0,1%<strong>EnerPrev</strong> IMA-B (A) 672.003 36,2%<strong>EnerPrev</strong> IMA-B (B) 669.944 36,0%Valores a Pagar e Receber (1.629) -0,1% Valores a Pagar e Receber 0 0,0%TOTAL RF 1.566.999 84,3% TOTAL RV 291.555 15,7%Caixa 46.416 - -TOTAL RECURSOS GARANTIDORES 1.904.969Relatório Anual <strong>2011</strong> 114