- Page 1:
Relatório Anual
- Page 4 and 5:
Relatório Anual 2011
- Page 6 and 7:
Objetivos parao futuroUma Entidade
- Page 8 and 9:
Conheça as nossasPatrocinadorasEDP
- Page 10 and 11:
CenárioeconômicoO ano de 2011 se
- Page 12 and 13:
Perfil daEntidadeNovos Planos e Imp
- Page 14 and 15:
Empréstimo em 2011ConcessõesR$ 1.
- Page 16 and 17:
Informações sobre as despesas com
- Page 18 and 19:
AlteraçõesRegulamentaresEm 2011,
- Page 20 and 21:
Balanços PatrimoniaisConsolidadoem
- Page 22 and 23:
Demonstração do Plano de Gestão
- Page 24 and 25:
Demonstrações do Ativo LíquidoPl
- Page 26 and 27:
Demonstrações do Ativo LíquidoPl
- Page 28 and 29:
Demonstrações do Ativo LíquidoPl
- Page 30 and 31:
Demonstrações do Ativo LíquidoPl
- Page 32 and 33:
Demonstrações do Ativo LíquidoPl
- Page 34 and 35:
Demonstrações do Ativo LíquidoPl
- Page 36 and 37:
Demonstrações do Ativo LíquidoPl
- Page 38 and 39:
Demonstrações das Mutações do A
- Page 40 and 41:
Demonstrações das Mutações do A
- Page 42 and 43:
Demonstrações das Mutações do A
- Page 44 and 45:
Demonstrações das Mutações do A
- Page 46 and 47:
Demonstrações das Mutações do A
- Page 48 and 49:
Demonstrações das Mutações do A
- Page 50 and 51:
Demonstrações das Mutações do A
- Page 52 and 53:
Demonstrações das Mutações do A
- Page 54 and 55:
Demonstrações do Plano de Gestão
- Page 56 and 57:
Demonstrações do Plano de Gestão
- Page 58 and 59:
Demonstrações do Plano de Gestão
- Page 60 and 61:
Demonstrações do Plano de Gestão
- Page 62 and 63:
Demonstrações do Plano de Gestão
- Page 64 and 65:
Demonstrações do Plano de Gestão
- Page 66 and 67:
Demonstrações das Obrigações At
- Page 68 and 69:
Demonstrações das Obrigações At
- Page 70 and 71:
Demonstrações das Obrigações At
- Page 72 and 73:
Demonstrações das Obrigações At
- Page 74 and 75:
Notas Explicativas àsDemonstraçõ
- Page 76 and 77:
d. ParticipantesOs participantes at
- Page 78 and 79:
3. Resumo das principais práticasc
- Page 80 and 81: 3.6 Apuração do resultadoOs compo
- Page 82 and 83: 4. DisponívelO saldo disponível e
- Page 84 and 85: 7. Realizável fluxo dos investimen
- Page 86 and 87: 7.1.2 Segregação por ativo e venc
- Page 88 and 89: 7.4 Investimentos ImobiliáriosInve
- Page 90 and 91: DescriçãoEscelsosPlano IEscelsosP
- Page 92 and 93: Planos 2011 - continuaçãoDescriç
- Page 94 and 95: Hipóteses EconômicasHipótese 201
- Page 96 and 97: Em 31 de dezembro de 2011, o Plano
- Page 98 and 99: Demonstrações do Ativo LíquidoPl
- Page 100 and 101: Demonstrações das Mutações do A
- Page 102 and 103: Demonstrações das Mutações do A
- Page 104 and 105: Demonstrações das Obrigações At
- Page 106 and 107: Demonstrações do plano de gestão
- Page 108 and 109: Informações sobre aPolítica de I
- Page 110 and 111: Plano Escelsos IIPeríodo: 01/2012
- Page 112 and 113: PSAP/Bandeirante (BD)Período: 03/2
- Page 114 and 115: Resumo doDemonstrativo de Investime
- Page 116 and 117: Plano de Benefícios: EDP - Renová
- Page 118 and 119: Plano de Benefícios: Energest(CNPB
- Page 120 and 121: Plano de Benefícios: Energias do B
- Page 122 and 123: Plano de Benefícios: Enerpeixe(CNP
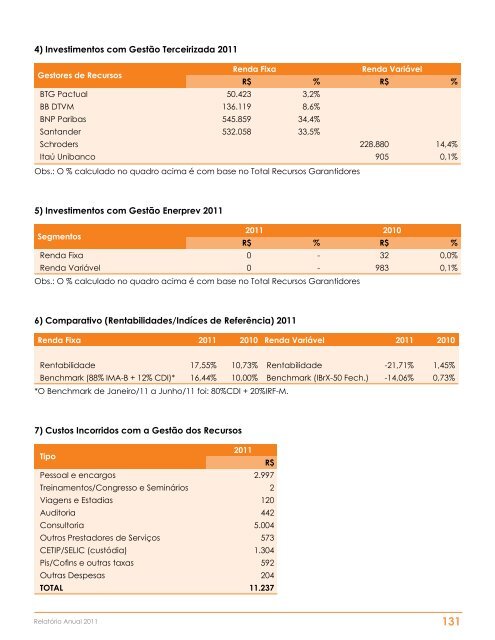
- Page 124 and 125: Plano de Benefícios: EnerPrev(CNPB
- Page 126 and 127: Plano de Benefícios: Enersul(CNPB
- Page 128 and 129: Plano de Benefícios: Enertrade(CNP
- Page 132 and 133: Plano de Benefícios: Pecém(CNPB 2
- Page 134 and 135: Plano de Benefícios: Investco(CNPB
- Page 136 and 137: Plano de Benefícios: Escelsos I(CN
- Page 138 and 139: Plano de Benefícios: Escelsos II(C
- Page 140 and 141: Plano de Benefícios: PSAP Bandeira
- Page 142 and 143: Plano de Gestão Administrativa (PG
- Page 144 and 145: Parecer Atuarial Consolidadodo Plan
- Page 146 and 147: ItemPatrimônio deCoberturaProvisõ
- Page 148 and 149: Parecer AtuarialPlano de Benefício
- Page 150 and 151: A patrocinadora optou por ajustar a
- Page 152 and 153: Valores em R$Equilíbrio Técnico 2
- Page 154 and 155: Parecer AtuarialPlano de Benefício
- Page 156 and 157: Fator de determinação do valor re
- Page 158 and 159: De acordo com o art. 7º da Resolu
- Page 160 and 161: VII - ConclusãoFace ao exposto, na
- Page 162 and 163: II - Hipóteses e Métodos Atuariai
- Page 164 and 165: IV - Patrimônio de Cobertura, Prov
- Page 166 and 167: Parcela CV Valores em R$Patrimônio
- Page 168 and 169: VII - ConclusãoFace ao exposto, na
- Page 170 and 171: Acreditamos que a evidência de aud
- Page 172 and 173: Ata da Reunião doConselho Delibera


