2011 - EnerPrev
2011 - EnerPrev
2011 - EnerPrev
- No tags were found...

Create successful ePaper yourself
Turn your PDF publications into a flip-book with our unique Google optimized e-Paper software.
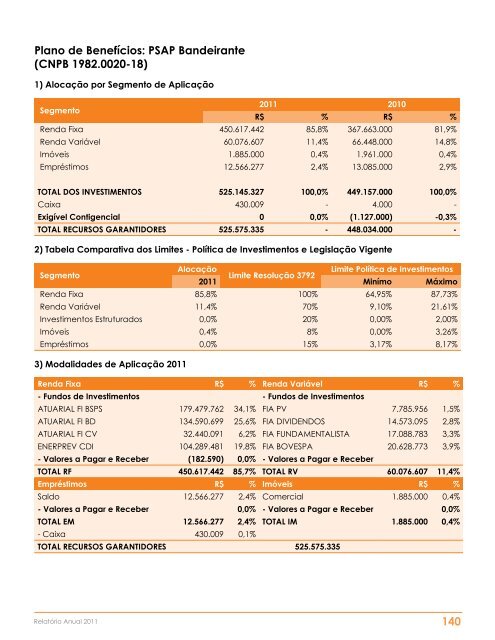
Plano de Benefícios: PSAP Bandeirante(CNPB 1982.0020-18)1) Alocação por Segmento de AplicaçãoSegmento<strong>2011</strong> 2010R$ % R$ %Renda Fixa 450.617.442 85,8% 367.663.000 81,9%Renda Variável 60.076.607 11,4% 66.448.000 14,8%Imóveis 1.885.000 0,4% 1.961.000 0,4%Empréstimos 12.566.277 2,4% 13.085.000 2,9%TOTAL DOS INVESTIMENTOS 525.145.327 100,0% 449.157.000 100,0%Caixa 430.009 - 4.000 -Exigível Contigencial 0 0,0% (1.127.000) -0,3%TOTAL RECURSOS GARANTIDORES 525.575.335 - 448.034.000 -2) Tabela Comparativa dos Limites - Política de Investimentos e Legislação VigenteSegmentoAlocaçãoLimite Política de InvestimentosLimite Resolução 3792<strong>2011</strong> Minímo MáximoRenda Fixa 85,8% 100% 64,95% 87,73%Renda Variável 11,4% 70% 9,10% 21,61%Investimentos Estruturados 0,0% 20% 0,00% 2,00%Imóveis 0,4% 8% 0,00% 3,26%Empréstimos 0,0% 15% 3,17% 8,17%3) Modalidades de Aplicação <strong>2011</strong>Renda Fixa R$ % Renda Variável R$ %- Fundos de Investimentos - Fundos de InvestimentosATUARIAL FI BSPS 179.479.762 34,1% FIA PV 7.785.956 1,5%ATUARIAL FI BD 134.590.699 25,6% FIA DIVIDENDOS 14.573.095 2,8%ATUARIAL FI CV 32.440.091 6,2% FIA FUNDAMENTALISTA 17.088.783 3,3%ENERPREV CDI 104.289.481 19,8% FIA BOVESPA 20.628.773 3,9%- Valores a Pagar e Receber (182.590) 0,0% - Valores a Pagar e ReceberTOTAL RF 450.617.442 85,7% TOTAL RV 60.076.607 11,4%Empréstimos R$ % Imóveis R$ %Saldo 12.566.277 2,4% Comercial 1.885.000 0,4%- Valores a Pagar e Receber 0,0% - Valores a Pagar e Receber 0,0%TOTAL EM 12.566.277 2,4% TOTAL IM 1.885.000 0,4%- Caixa 430.009 0,1%TOTAL RECURSOS GARANTIDORES 525.575.335Relatório Anual <strong>2011</strong> 140