2011 - EnerPrev
2011 - EnerPrev
2011 - EnerPrev
- No tags were found...

Create successful ePaper yourself
Turn your PDF publications into a flip-book with our unique Google optimized e-Paper software.
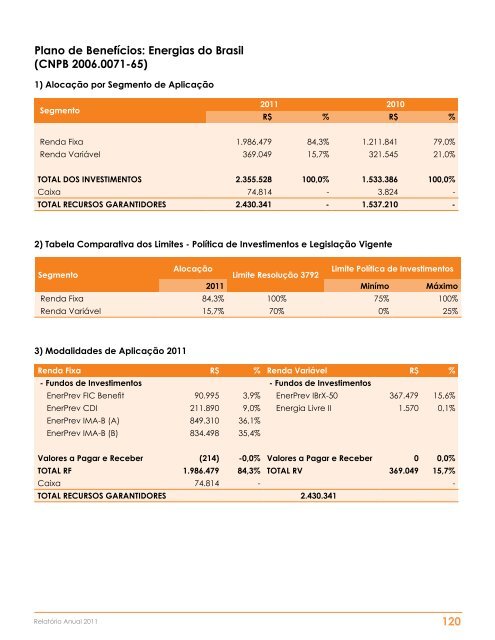
Plano de Benefícios: Energias do Brasil(CNPB 2006.0071-65)1) Alocação por Segmento de AplicaçãoSegmento<strong>2011</strong> 2010R$ % R$ %Renda Fixa 1.986.479 84,3% 1.211.841 79,0%Renda Variável 369.049 15,7% 321.545 21,0%TOTAL DOS INVESTIMENTOS 2.355.528 100,0% 1.533.386 100,0%Caixa 74.814 - 3.824 -TOTAL RECURSOS GARANTIDORES 2.430.341 - 1.537.210 -2) Tabela Comparativa dos Limites - Política de Investimentos e Legislação VigenteSegmentoAlocaçãoLimite Resolução 3792Limite Política de Investimentos<strong>2011</strong> Minímo MáximoRenda Fixa 84,3% 100% 75% 100%Renda Variável 15,7% 70% 0% 25%3) Modalidades de Aplicação <strong>2011</strong>Renda Fixa R$ % Renda Variável R$ %- Fundos de Investimentos - Fundos de Investimentos<strong>EnerPrev</strong> FIC Benefit 90.995 3,9% <strong>EnerPrev</strong> IBrX-50 367.479 15,6%<strong>EnerPrev</strong> CDI 211.890 9,0% Energia Livre II 1.570 0,1%<strong>EnerPrev</strong> IMA-B (A) 849.310 36,1%<strong>EnerPrev</strong> IMA-B (B) 834.498 35,4%Valores a Pagar e Receber (214) -0,0% Valores a Pagar e Receber 0 0,0%TOTAL RF 1.986.479 84,3% TOTAL RV 369.049 15,7%Caixa 74.814 - -TOTAL RECURSOS GARANTIDORES 2.430.341Relatório Anual <strong>2011</strong> 120