2011 - EnerPrev
2011 - EnerPrev
2011 - EnerPrev
- No tags were found...

Create successful ePaper yourself
Turn your PDF publications into a flip-book with our unique Google optimized e-Paper software.
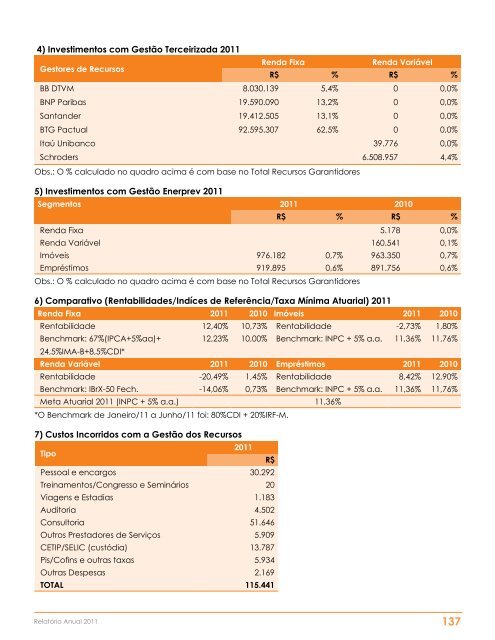
4) Investimentos com Gestão Terceirizada <strong>2011</strong>Gestores de RecursosRenda FixaRenda VariávelR$ % R$ %BB DTVM 8.030.139 5,4% 0 0,0%BNP Paribas 19.590.090 13,2% 0 0,0%Santander 19.412.505 13,1% 0 0,0%BTG Pactual 92.595.307 62,5% 0 0,0%Itaú Unibanco 39.776 0,0%Schroders 6.508.957 4,4%Obs.: O % calculado no quadro acima é com base no Total Recursos Garantidores5) Investimentos com Gestão Enerprev <strong>2011</strong>Segmentos <strong>2011</strong> 2010R$ % R$ %Renda Fixa 5.178 0,0%Renda Variável 160.541 0,1%Imóveis 976.182 0,7% 963.350 0,7%Empréstimos 919.895 0,6% 891.756 0,6%Obs.: O % calculado no quadro acima é com base no Total Recursos Garantidores6) Comparativo (Rentabilidades/Indíces de Referência/Taxa Mínima Atuarial) <strong>2011</strong>Renda Fixa <strong>2011</strong> 2010 Imóveis <strong>2011</strong> 2010Rentabilidade 12,40% 10,73% Rentabilidade -2,73% 1,80%Benchmark: 67%(IPCA+5%aa)+12,23% 10,00% Benchmark: INPC + 5% a.a. 11,36% 11,76%24,5%IMA-B+8,5%CDI*Renda Variável <strong>2011</strong> 2010 Empréstimos <strong>2011</strong> 2010Rentabilidade -20,49% 1,45% Rentabilidade 8,42% 12,90%Benchmark: IBrX-50 Fech. -14,06% 0,73% Benchmark: INPC + 5% a.a. 11,36% 11,76%Meta Atuarial <strong>2011</strong> (INPC + 5% a.a.) 11,36%*O Benchmark de Janeiro/11 a Junho/11 foi: 80%CDI + 20%IRF-M.7) Custos Incorridos com a Gestão dos RecursosTipo<strong>2011</strong>R$Pessoal e encargos 30.292Treinamentos/Congresso e Seminários 20Viagens e Estadias 1.183Auditoria 4.502Consultoria 51.646Outros Prestadores de Serviços 5.909CETIP/SELIC (custódia) 13.787Pis/Cofins e outras taxas 5.934Outras Despesas 2.169TOTAL 115.441Relatório Anual <strong>2011</strong> 137