2011 - EnerPrev
2011 - EnerPrev
2011 - EnerPrev
- No tags were found...

You also want an ePaper? Increase the reach of your titles
YUMPU automatically turns print PDFs into web optimized ePapers that Google loves.
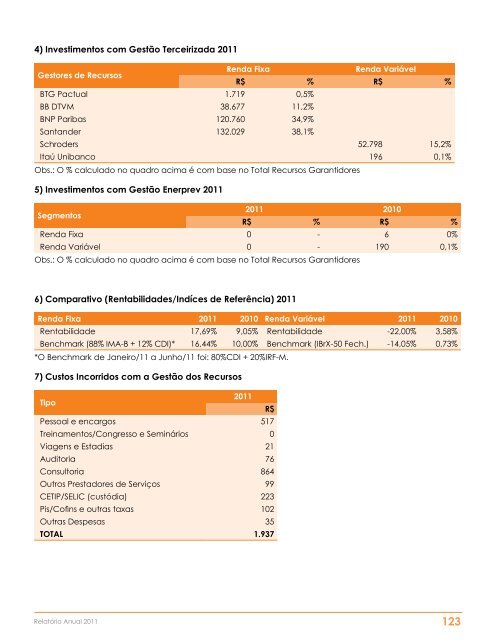
4) Investimentos com Gestão Terceirizada <strong>2011</strong>Gestores de RecursosRenda FixaRenda VariávelR$ % R$ %BTG Pactual 1.719 0,5%BB DTVM 38.677 11,2%BNP Paribas 120.760 34,9%Santander 132.029 38,1%Schroders 52.798 15,2%Itaú Unibanco 196 0,1%Obs.: O % calculado no quadro acima é com base no Total Recursos Garantidores5) Investimentos com Gestão Enerprev <strong>2011</strong>Segmentos<strong>2011</strong> 2010R$ % R$ %Renda Fixa 0 - 6 0%Renda Variável 0 - 190 0,1%Obs.: O % calculado no quadro acima é com base no Total Recursos Garantidores6) Comparativo (Rentabilidades/Indíces de Referência) <strong>2011</strong>Renda Fixa <strong>2011</strong> 2010 Renda Variável <strong>2011</strong> 2010Rentabilidade 17,69% 9,05% Rentabilidade -22,00% 3,58%Benchmark (88% IMA-B + 12% CDI)* 16,44% 10,00% Benchmark (IBrX-50 Fech.) -14,05% 0,73%*O Benchmark de Janeiro/11 a Junho/11 foi: 80%CDI + 20%IRF-M.7) Custos Incorridos com a Gestão dos RecursosTipo<strong>2011</strong>R$Pessoal e encargos 517Treinamentos/Congresso e Seminários 0Viagens e Estadias 21Auditoria 76Consultoria 864Outros Prestadores de Serviços 99CETIP/SELIC (custódia) 223Pis/Cofins e outras taxas 102Outras Despesas 35TOTAL 1.937Relatório Anual <strong>2011</strong> 123