- Page 2 and 3:
U.S. International Trade Commission
- Page 4 and 5:
This report was prepared principall
- Page 6 and 7:
CONTENTS-Continued Chapter 3. Secto
- Page 8 and 9:
CONTENTS—Continued Chapter 5. Imp
- Page 10 and 11:
CONTENTS-Continued Chapter 7. Liter
- Page 12 and 13:
CONTENTS-Continued Tables—Continu
- Page 15 and 16:
Abbreviations and Acronyms 3G third
- Page 17 and 18:
Abbreviations and Acronyms—Contin
- Page 19:
Abbreviations and Acronyms—Contin
- Page 22 and 23:
vehicles) would likely be diverted
- Page 24 and 25:
Sector-specific Assessments The U.S
- Page 26 and 27:
total increased fish imports from K
- Page 28 and 29:
Korea would likely limit the impact
- Page 30 and 31:
Intellectual property rights (IPR):
- Page 32 and 33:
sector barriers. 5 These merchandis
- Page 34 and 35:
Table 1.1 U.S.-Korea FTA: Location
- Page 36 and 37:
Table 1.2 Korean tariff rates on im
- Page 38 and 39:
Table 1.4 U.S.-Korea FTA: Summary o
- Page 40 and 41:
observed GDP for model regions). Th
- Page 42 and 43:
Box 2.1 Interpreting the model resu
- Page 44 and 45:
Table 2.1 U.S.-Korea FTA: Simulated
- Page 46 and 47:
2-8 This page has been updated to r
- Page 48 and 49:
Figure 2.2 U.S-Korea FTA: Simulated
- Page 50 and 51:
As shown in figure 2.2, the largest
- Page 52 and 53:
2-14 This page has been updated to
- Page 54 and 55:
Economy-wide Impact of Implementing
- Page 56 and 57:
Grain (Wheat, Corn, and Other Feed
- Page 58 and 59:
Korea imported 3.8 million mt of wh
- Page 60 and 61:
U.S. oilseed product exports to Kor
- Page 62 and 63:
Table 3.2 U.S. oilseed product expo
- Page 64 and 65:
Table 3.3 Animal feed exports to Ko
- Page 66 and 67:
consumed domestically by the U.S. l
- Page 68 and 69:
ates. For corn starch, the United S
- Page 70 and 71:
quota rates have been effectively e
- Page 72 and 73:
Noncitrus Fruit 87 Views of Interes
- Page 74 and 75:
3-20 Table 3.9 U.S.-Korea trade and
- Page 76 and 77:
Korean grapes are much more costly
- Page 78 and 79:
Potato Products 122 Assessment The
- Page 80 and 81:
ate is 304 percent ad valorem. 141
- Page 82 and 83:
Other Vegetables 162 Assessment The
- Page 84 and 85:
U.S. exports of other fresh and pro
- Page 86 and 87:
tariff concessions that could accru
- Page 88 and 89:
Dairy Products 215 Similarly, the p
- Page 90 and 91:
TRQ for food whey, 223 based on cur
- Page 92 and 93:
potential changes in trade based so
- Page 94 and 95:
Figure Figure 3.1 Korea: Beef and v
- Page 96 and 97:
Views of Interested Parties The inc
- Page 98 and 99:
are subject to the same food safety
- Page 100 and 101:
enefit under the provisions of this
- Page 102 and 103:
Box 3.2 Potential price and quantit
- Page 104 and 105:
50 percent, while the vegetable jui
- Page 106 and 107:
and major supplier, and U.S. tariff
- Page 108 and 109:
textiles and apparel through 2005.
- Page 110 and 111:
U.S. Exports The impact of the FTA
- Page 112 and 113:
passage. NCTO indicated that, even
- Page 114 and 115:
In its report, the ITAC on Distribu
- Page 116 and 117:
of the U.S. footwear market, with C
- Page 118 and 119:
of these producers. 362 RPFMA noted
- Page 120 and 121:
prohibit improper inducements by ph
- Page 122 and 123:
Machinery, Electronics, and Transpo
- Page 124 and 125:
U.S. exports of auto parts would be
- Page 126 and 127:
imports from and exports to Korea.
- Page 128 and 129:
Passenger Vehicles 433 Assessment U
- Page 130 and 131:
Table 3.16 Korean passenger vehicle
- Page 132 and 133:
import activities have continued
- Page 134 and 135:
Box 3.4 Automotive-related FTA Prov
- Page 136 and 137:
access. The FTA affirms the parties
- Page 138 and 139:
gaining U.S. market share regardles
- Page 140 and 141:
keep the products out.” 492 Mr. B
- Page 142 and 143:
these vehicles to Korea. The commit
- Page 144 and 145:
Brown expressed concern about the r
- Page 146 and 147:
goods; and high-technology medical,
- Page 148 and 149:
device pricing, reimbursement, and
- Page 151 and 152:
CHAPTER 4 Impact of Market Access P
- Page 153 and 154:
elative to GDP than do China, Japan
- Page 155 and 156:
services as a substantial improveme
- Page 157 and 158:
Box 4.2 Financial services: Competi
- Page 159 and 160:
Summary of Provisions Chapter 13 of
- Page 161 and 162:
national treatment, full establishm
- Page 163 and 164:
Box 4.4 Competitive conditions in t
- Page 165 and 166:
and cross-connect links 70 are more
- Page 167 and 168:
Box 4.5 U.S. legal services trade w
- Page 169 and 170:
establish offices in Korea to provi
- Page 171 and 172:
Box 4.6 Competitive conditions in t
- Page 173 and 174:
equirements and foreign ownership r
- Page 175 and 176:
CHAPTER 5 Impact of Trade Facilitat
- Page 177 and 178:
publication and administration of t
- Page 179 and 180:
Views of Interested Parties In its
- Page 181 and 182:
Summary of Provisions This chapter
- Page 183 and 184:
use of TBTs to protect Korea’s au
- Page 185 and 186: conformity assessment procedures el
- Page 187 and 188: FTA Chapter 15-Electronic Commerce
- Page 189: Views of Interested Parties The U.S
- Page 192 and 193: quantities as to be a substantial c
- Page 194 and 195: that such transshipment could imped
- Page 196 and 197: Box 6.1 Foreign investment in Korea
- Page 198 and 199: in the FTA. The awards made by any
- Page 200 and 201: Table 6.1 U.S.-Korea FTA: Industry
- Page 202 and 203: (ITAC 5) report cited as particular
- Page 204 and 205: Section C of Chapter 11 and the lac
- Page 206 and 207: practices, and violations of consum
- Page 208 and 209: FTA Chapter 17—Government Procure
- Page 210 and 211: Both the United States and Korea ar
- Page 212 and 213: 8) 87 also expressed support for th
- Page 214 and 215: Box 6.2 Recent conditions of IPR pr
- Page 216 and 217: protection to life of the author pl
- Page 218 and 219: Views of Interested Parties A numbe
- Page 220 and 221: GPHA stated in testimony before the
- Page 222 and 223: Box 6.3 Labor market conditions in
- Page 224 and 225: FTA Chapter 20—Environment 131 As
- Page 226 and 227: trade measures are the least disrup
- Page 228 and 229: FTA Chapter 22-Institutional Provis
- Page 230 and 231: Views of Interested Parties The Ind
- Page 233 and 234: CHAPTER 7 Literature Review and Sum
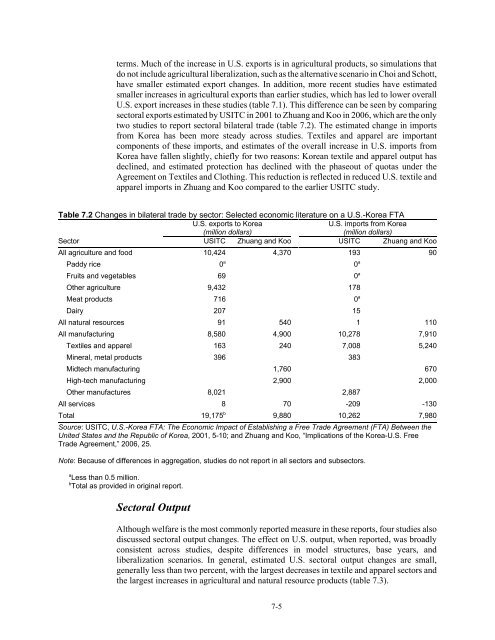
- Page 235: 7-3 Table 7.1 Model, liberalization
- Page 239 and 240: Liberalization generated small incr
- Page 241 and 242: Sander Levin, Member of the U.S. Ho
- Page 243 and 244: Regarding footwear and travel goods
- Page 245 and 246: Korea’s establishment as a region
- Page 247 and 248: The California Table Grape Commissi
- Page 249 and 250: order activity, and facilitate expa
- Page 251 and 252: At the Commission’s hearing, Mr.
- Page 253 and 254: Information Technology Industry Cou
- Page 255 and 256: With respect to tariff and nontarif
- Page 257 and 258: deterring illegal transshipments. I
- Page 259 and 260: PhRMA identified what it views as t
- Page 261 and 262: the TIA stated that it supports the
- Page 263 and 264: access to the market. The Council a
- Page 265 and 266: United States, Spain, Chile, Brazil
- Page 267 and 268: Bibliography Advanced Medical Techn
- Page 269 and 270: AT&T. “AT&T Reaction to Free Trad
- Page 271 and 272: ______. “Korea-U.S. Free Trade Re
- Page 273 and 274: ______. “Country Finance: South K
- Page 275 and 276: Global Trade Information Services I
- Page 277 and 278: International Labor Organization (I
- Page 279 and 280: Jones, Laura E. Executive Director.
- Page 281 and 282: Lee, Hyunok, and Daniel A. Sumner.
- Page 283 and 284: Nam, In-Soo. “Helio's Losses To W
- Page 285 and 286: Powers, Mark. Northwest Horticultur
- Page 287 and 288:
Smith, Brad. American Council of Li
- Page 289 and 290:
U.S.-Korea Business Council (USKBC)
- Page 291 and 292:
______. “Korea, Republic of Oilse
- Page 293 and 294:
U.S. International Trade Commission
- Page 295 and 296:
Ward, David. American Council on Ed
- Page 297:
APPENDIX A Request Letter from USTR
- Page 301:
APPENDIX B Federal Register Notices
- Page 304 and 305:
pwalker on PROD1PC71 with NOTICES 2
- Page 307:
APPENDIX C Hearing Participants
- Page 310 and 311:
ORGANIZATION AND WITNESS: PANEL 1 (
- Page 313:
APPENDIX D U.S.-Korea FTA: Chapter-
- Page 316 and 317:
fees and charges on trade in goods
- Page 318 and 319:
determines the tariff classificatio
- Page 320 and 321:
The transparency provisions would a
- Page 322 and 323:
necessary duties within 1 year of i
- Page 324 and 325:
technical regulation or conformity
- Page 326 and 327:
procedures), and practices of a par
- Page 328 and 329:
aviation, fisheries, or maritime ma
- Page 330 and 331:
of standards and criteria and on te
- Page 332 and 333:
of the FTA that impose unilateral o
- Page 334 and 335:
use of electronic authentication in
- Page 336 and 337:
parties’ rights and obligations u
- Page 338 and 339:
establishment of Uniform Domain-Nam
- Page 340 and 341:
government to take appropriate meas
- Page 342 and 343:
environmental laws. 102 In the U.S.
- Page 344 and 345:
not limited to, policies on commerc
- Page 347 and 348:
Economic indicators 2002 2006 Popul
- Page 349 and 350:
Table E.1 Leading U.S. exports to K
- Page 351:
APPENDIX F GTAP Model
- Page 354 and 355:
Updating the GTAP Database The curr
- Page 356 and 357:
Key Assumptions Agency. 4 The price
- Page 358 and 359:
Table F.2 U.S.-Korea FTA benchmark
- Page 360 and 361:
Measuring the Impacts of the FTA an
- Page 363 and 364:
General Effects of Trade Agreements
- Page 365:
APPENDIX H Tariff Equivalents in Ko
- Page 368 and 369:
Previous Literature The method for
- Page 370 and 371:
For the purposes of this report, a
- Page 372 and 373:
Table H.1 Tariff equivalents in Kor
- Page 375:
APPENDIX I Services Nonconforming M
- Page 378 and 379:
Table I.1 U.S.-Korea FTA: Korean se
- Page 381:
APPENDIX J Description of Possible
- Page 384 and 385:
are in effect import prices, and th
- Page 387:
APPENDIX K Overview of Agricultural
- Page 390 and 391:
Additionally, although current regu
- Page 392:
About This Report The United States