My PhD dissertation - Institut Fresnel
My PhD dissertation - Institut Fresnel
My PhD dissertation - Institut Fresnel

You also want an ePaper? Increase the reach of your titles
YUMPU automatically turns print PDFs into web optimized ePapers that Google loves.
96<br />
31 P NMR settings: It is known that the Nuclear Overhauser Effect (NOE) causes change in the<br />
integration intensity during 1 H decoupling. Thus, all spectra were recorded in a 1 H-nondecoupling<br />
mode. Furthermore, pulse delay time must be long enough to allow complete relaxation of the nuclei<br />
and thus quantitative measurements. Hence, a typical experiment based on the progressive saturation<br />
[ , ]<br />
and saturation recovery 233 234 was applied to the phosphonium salts in order to determine the<br />
minimum spin-lattice relaxation time T1(min.). To insure complete relaxation of all nuclei considered,<br />
the experimental relaxation time T1(exp.) was then set to 5T1(min.). The effective NMR settings used<br />
were data points 32K, spectral width 19000 Hz, pulse width 12.0 µsec (pulse angle 90°), pulse delay<br />
time 30 sec, and number of FID accumulation 256.<br />
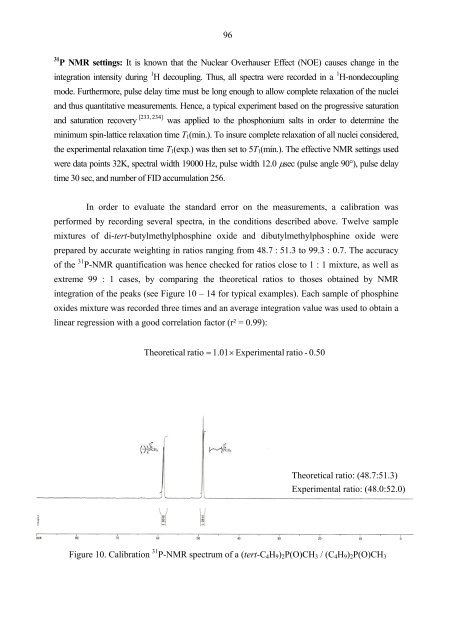
In order to evaluate the standard error on the measurements, a calibration was<br />
performed by recording several spectra, in the conditions described above. Twelve sample<br />
mixtures of di-tert-butylmethylphosphine oxide and dibutylmethylphosphine oxide were<br />
prepared by accurate weighting in ratios ranging from 48.7 : 51.3 to 99.3 : 0.7. The accuracy<br />
of the 31 P-NMR quantification was hence checked for ratios close to 1 : 1 mixture, as well as<br />
extreme 99 : 1 cases, by comparing the theoretical ratios to thoses obtained by NMR<br />
integration of the peaks (see Figure 10 – 14 for typical examples). Each sample of phosphine<br />
oxides mixture was recorded three times and an average integration value was used to obtain a<br />
linear regression with a good correlation factor (r² = 0.99):<br />
Theoretica l ratio = 1.01×<br />
Experimental<br />
ratio - 0.50<br />
Theoretical ratio: (48.7:51.3)<br />
Experimental ratio: (48.0:52.0)<br />
Figure 10. Calibration 31 P-NMR spectrum of a (tert-C4H9)2P(O)CH3 / (C4H9)2P(O)CH3