- Page 1 and 2:
Geologic Studies in Alaska by the U
- Page 3 and 4:
CONTENTS Introduction Cynthia Dusel
- Page 5 and 6:
CONTENTS CONTRIBUTORS TO THIS BULLE
- Page 7 and 8:
GEOLOGIC STUDIES IN ALASKA BY THE U
- Page 9 and 10:
LATE HOLOCENE LONGITUDINAL AND PARA
- Page 11 and 12:
LATE HOLOCENE LONGITUDINAL AND PARA
- Page 13 and 14:
LATE HOLOCENE LONGITUDINAL AND PARA
- Page 15 and 16:
LATE HOLOCENE LONGITUDINAL AND PARA
- Page 17 and 18:
LATE HOLOCENE LONGITUDINAL AND PARA
- Page 19 and 20:
DEEP-WATER LITHOFACIES AND CONODONT
- Page 21 and 22:
DEEP-WATER LITHOFACIES AND CONODONT
- Page 23 and 24:
DEEP-WATER LITHOFACIES AND CONODONT
- Page 25 and 26:
Table 1. Locality register for key
- Page 27 and 28:
Table 1. Locality register for key
- Page 29 and 30:
DEEP-WATER LITHOFACIES AND CONODONT
- Page 31 and 32:
DEEP-WATER LITHOFACIES AND CONODONT
- Page 33 and 34:
DEEP-WATER LITHOFACIES AND CONODONT
- Page 35 and 36:
DEEP-WATER LITHOFACIES AND CONODONT
- Page 37 and 38:
LITHOFACIES AND CONODONTS OF CARBON
- Page 39 and 40:
LITHOFACIES AND CONODONTS OF CARBON
- Page 41 and 42:
LITHOFACIES AND CONODONTS OF CARBON
- Page 43 and 44:
LITHOFACIES AND CONODONTS OF CARBON
- Page 45 and 46:
LITHOFACIES AND CONODONTS OF CARBON
- Page 47 and 48:
LITHOFACIES AND CONODONTS OF CARBON
- Page 49 and 50:
LITHOFACES AND CONODONTS OF CARBONI
- Page 51 and 52:
Table 1. Conodont faunules and lith
- Page 53 and 54:
LITHOFACIES AND CONODONTS OF CARBON
- Page 55 and 56:
DEPOSITIONAL SEQUENCES IN ATIGUN SY
- Page 57 and 58:
DEPOSITIONAL SEQUENCES IN ATIGUN SY
- Page 59 and 60:
DEPOSITIONAL SEQUENCES IN ATIGUN SY
- Page 61 and 62:
DEPOSITIONAL SEQUENCES IN ATIGUN SY
- Page 63 and 64:
DEPOSITIONAL SEQUENCES IN ATIGUN SY
- Page 65 and 66:
U-Pb AGES OF ZIRCON, MONAZITE, AND
- Page 67 and 68:
U-Pb AGES OF ZIRCON, MONAZITE, AND
- Page 69 and 70:
U-Pb AGES OF ZIRCON, MONAZITE, AND
- Page 71 and 72:
U-Pb AGES OF ZIRCON, MONAZITE, AND
- Page 73 and 74:
U-Pb AGES OF ZIRCON, MONAZITE, AND
- Page 75 and 76:
U-Pb AGES OF ZIRCON, MONAZITE, AND
- Page 77 and 78:
APPEAL FOR NONPROLIFERATION OF ESCA
- Page 79 and 80:
APPEAL FOR NONPROLIFERATION OF ESCA
- Page 81 and 82:
APPEAL FOR NONPROLIFERATION OF ESCA
- Page 83 and 84:
APPEAL FOR NONPROLIFERATION OF ESCA
- Page 85 and 86:
FAVORABLE AREAS FOR METALLIC MINERA
- Page 87 and 88:
FAVORABLE AREAS FOR METALLIC MINERA
- Page 89 and 90:
FAVORABLE AREAS FOR METALLIC MINERA
- Page 91 and 92:
FAVORABLE AREAS FOR METALLIC MINERA
- Page 93 and 94:
FAVORABLE AREAS FOR METALLIC MINERA
- Page 95 and 96:
FAVORABLE AREAS FOR METALLIC MINERA
- Page 97 and 98:
GOLD AND CINNABAR IN HEAVY-MINERAL
- Page 99 and 100:
GOLD AND CINNABAR IN HEAVY-MINERAL
- Page 101 and 102:
GOLD AND CINNABAR IN HEAVY-MINERAL
- Page 103 and 104:
GOLD AND CINNABAR IN HEAVY-MINERAL
- Page 105 and 106:
GOLD AND CINNABAR IN HEAVY-MINERAL
- Page 107 and 108:
EARLY CENOZOIC DEPOSITIONAL SYSTEMS
- Page 109 and 110:
EARLY CENOZOIC DEPOSITIONAL SYSTEMS
- Page 111 and 112:
EARLY CENOZOIC DEPOSITIONAL S YSTEM
- Page 113 and 114:
EARLY CENOZOIC DEPOSITIONAL SYSTEMS
- Page 115 and 116:
EARLY CENOZOIC DEPOSITIONAL SYSTEMS
- Page 117 and 118:
EARLY CENOZOIC DEPOSITIONAL SYSTEMS
- Page 119 and 120:
EARLY CENOZOIC DEPOSITIONAL SYSTEMS
- Page 121 and 122:
EARLY CENOZOIC DEPOSITIONAL SYSTEMS
- Page 123 and 124:
EARLY CENOZOIC DEPOSITIONAL SYSTEMS
- Page 125 and 126:
RESERVOIR FRAMEWORK ARCHITECTURE, C
- Page 127 and 128:
RESERVOIR FRAMEWORK ARCHITECTURE, C
- Page 129 and 130:
RESERVOIR FRAMEWORK ARCHITECTURE, C
- Page 131 and 132:
RESERVOIR FRAMEWORK ARCHITECTURE, C
- Page 133 and 134:
RESERVOIR FRAMEWORK ARCHITECTURE, C
- Page 135 and 136:
RESERVOIR FRAMEWORK ARCHITECTURE, C
- Page 137: GEOCHEMISTRY OF OPHIOLITIC ROCKS FR
- Page 140 and 141: 134 GEOLOGIC STUDIES IN ALASKA BY '
- Page 142 and 143: 136 GEOLOGIC STUDIES IN ALASKA BY T
- Page 144 and 145: 138 GEOLOGIC STUDIES IN ALASKA BY T
- Page 146 and 147: 140 GEOLOGIC STUDIES IN ALASKA BY T
- Page 148 and 149: 142 GEOLOGIC STUDIES IN ALASKA BY T
- Page 150 and 151: 144 GEOLOGIC STUDIES IN ALASKA BY T
- Page 152 and 153: 146 GEOLOGIC STUDIES IN ALASKA BY T
- Page 154 and 155: GEOLOGIC STUDIES IN ALASKA BY THE U
- Page 156 and 157: 1 150 GEOLOGIC STUDIES IN ALASKA BY
- Page 158 and 159: 152 GEOLOGIC STUDIES IN ALASKA BY T
- Page 160 and 161: 154 GEOLOGIC STUDIES IN ALASKA BY T
- Page 162 and 163: 156 GEOLOGIC STUDIES IN ALASKA BY T
- Page 164 and 165: 158 GEOLOGIC STUDIES IN ALASKA BY T
- Page 166 and 167: 160 GEOLOGIC STUDIES IN ALASKA BY T
- Page 168 and 169: 162 GEOLOGIC STUDIES IN ALASKA BY T
- Page 170 and 171: 1 64 GEOLOGIC STUDlES IN ALASKA BY
- Page 172 and 173: 166 GEOLOGIC STUDES IN ALASKA BY TH
- Page 174 and 175: 168 GEOLOGIC STUDIES IN ALASKA BY T
- Page 176 and 177: 170 GEOLOGIC STUDIES IN ALASKA BY T
- Page 178 and 179: 172 GEOLOGIC STUDIES IN ALASKA BY T
- Page 180 and 181: Table 1. Isotopic ages of intrusive
- Page 182 and 183: Table 1. Isotopic ages of intrusive
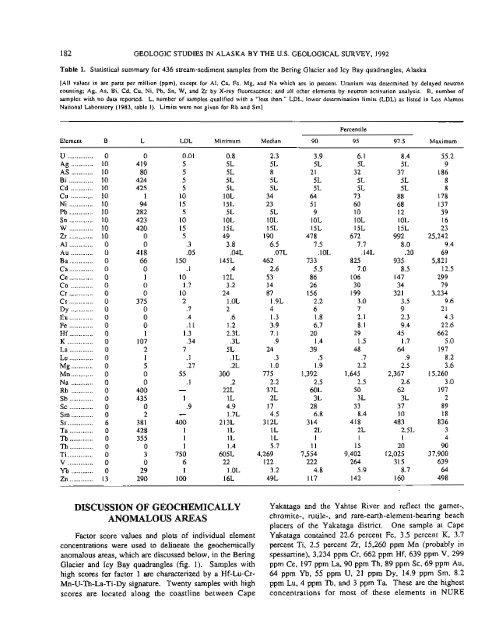
- Page 184 and 185: GEOCHEMICAL EVALUATION OF STREAM-SE
- Page 186 and 187: 180 GEOLOGIC STUDIES IN ALASKA BY T
- Page 190 and 191: 184 GEOLOGIC STUDIES IN ALASKA BY T
- Page 192 and 193: 186 GEOLOGIC STUDIES IN ALASKA BY T
- Page 194 and 195: 188 GEOLOGIC STUDIES IN ALASKA BY T
- Page 196 and 197: 190 GEOLOGIC STUDIES IN ALASKA BY T
- Page 198 and 199: 192 GEOLOGIC STUDIES IN ALASKA BY T
- Page 200 and 201: 194 GEOLOGIC STUDIES IN ALASKA BY T
- Page 202 and 203: 196 GEOLOGIC STUDIES IN ALASKA BY T
- Page 204 and 205: 198 GEOLOGIC STUDIES IN ALASKA BY T
- Page 206 and 207: 20 GEOLOGIC STUDIES IN ALASKA BY TH
- Page 208 and 209: 202 GEOLOGIC STUDIES IN ALASKA BY T
- Page 210 and 211: 204 GEOLOGIC STUDIES IN ALASKA BY T
- Page 212 and 213: Table 3. Summary of geochemical sig
- Page 214 and 215: 208 GEOLOGIC STUDIES IN ALASKA BY T
- Page 216: 210 GEOLOGIC STUDIES IN ALASKA BY T
- Page 219 and 220: GEOCHEMICAL CHARACTER OF UPPER PALE
- Page 221 and 222: GEOCHEMICAL CHARACTER OF UPPER PALE
- Page 223 and 224: GEOCHEMICAL CHARACTER OF UPPER PALE
- Page 225 and 226: RECONNAISSANCE GEOCHEMISTRY OF BASA
- Page 227 and 228: RECONNAISSANCE GEOCHEMISTRY OF BASA
- Page 229 and 230: RECONNAISSANCE GEOCHEMISTRY OF BASA
- Page 231 and 232: RECONNAISSANCE GEOCHEMISTRY OF BASA
- Page 233 and 234: RECONNAISSANCE GEOCHEMISTRY OF BASA
- Page 235 and 236: OSTRACODE ASSEMBLAGES FROM MODERN B
- Page 237 and 238: OSTRACODE ASSEMBLAGES FROM MODERN B
- Page 239 and 240:
OSTRACODE ASSEMBLAGES FROM MODERN B
- Page 241 and 242:
OSTRACODE ASSEMBLAGES FROM MODERN B
- Page 243 and 244:
RUBIDIUM-STRONTIUM ISOTOPIC SYSTEMA
- Page 245 and 246:
RUBIDIUM-STRONTIUM ISOTOPIC SYSTEMA
- Page 247 and 248:
US. GEOLOGICAL SURVEY REPORTS ON AL
- Page 249 and 250:
U.S. GEOLOGICAL SURVEY REPORTS ON A
- Page 251 and 252:
U.S. GEOLOGICAL SURVEY REPOR TS ON
- Page 253 and 254:
REPORTS ABOUT ALASKA IN NON-USGS PU
- Page 255 and 256:
REPORTS ABOUT ALASKA IN NON-USGS PU