Securitas AB Annual Report 2005
Securitas AB Annual Report 2005
Securitas AB Annual Report 2005

You also want an ePaper? Increase the reach of your titles
YUMPU automatically turns print PDFs into web optimized ePapers that Google loves.
The Group – The share, shareholders and dividend<br />
10.50<br />
8.75<br />
7.00<br />
5.25<br />
3.50<br />
1.75<br />
0.00<br />
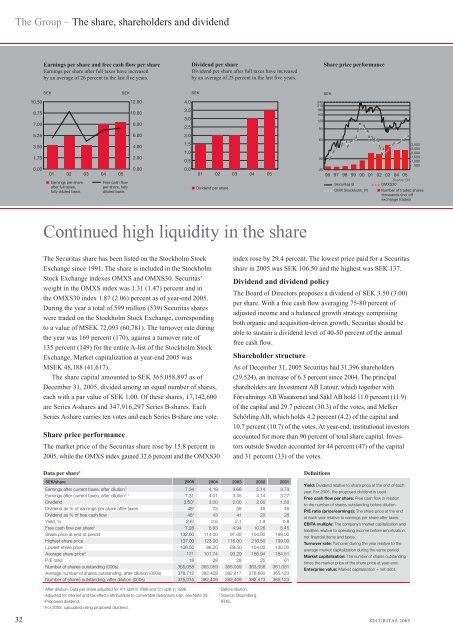
Earnings per share and free cash flow per share<br />
Earnings per share after full taxes have increased<br />
by an average of 26 percent in the last five years.<br />
SEK SEK<br />
01 02 03 04 05<br />
■ Earnings per share<br />
after full taxes,<br />
fully diluted basis<br />
Free cash flow<br />
per share, fully<br />
diluted basis<br />
12.00<br />
10.00<br />
Continued high liquidity in the share<br />
The <strong>Securitas</strong> share has been listed on the Stockholm Stock<br />
Exchange since 1991. The share is included in the Stockholm<br />
Stock Exchange indexes OMXS and OMXS30. <strong>Securitas</strong>’<br />
weight in the OMXS index was 1.31 (1.47) percent and in<br />
the OMXS30 index 1.87 (2.06) percent as of year-end <strong>2005</strong>.<br />
During the year a total of 599 million (539) <strong>Securitas</strong> shares<br />
were traded on the Stockholm Stock Exchange, corresponding<br />
to a value of MSEK 72,093 (60,781). The turnover rate during<br />
the year was 169 percent (170), against a turnover rate of<br />
135 percent (149) for the entire A-list of the Stockholm Stock<br />
Exchange. Market capitalization at year-end <strong>2005</strong> was<br />
MSEK 48,188 (41,617).<br />
The share capital amounted to SEK 365,058,897 as of<br />
December 31, <strong>2005</strong>, divided among an equal number of shares,<br />
each with a par value of SEK 1.00. Of these shares, 17,142,600<br />
are Series A -shares and 347,916,297 Series B -shares.<br />
Each<br />
Series A -share carries ten votes and each Series B -share<br />
one vote.<br />
Share price performance<br />
The market price of the <strong>Securitas</strong> share rose by 15.8 percent in<br />
<strong>2005</strong>, while the OMXS index gained 32.6 percent and the OMXS30<br />
8.00<br />
6.00<br />
4.00<br />
2.00<br />
0.00<br />
■ Dividend per share<br />
Data per share1 SEK/share <strong>2005</strong> 2004 2003 2002 2001<br />
Earnings after current taxes, after dilution 2 7.34 4.19 3.66 5.14 3.73<br />
Earnings after current taxes, after dilution 2, 7 7.31 4.01 3.45 4.14 3.27<br />
Dividend 3.503 3.00 2.00 2.00 1.50<br />
Dividend as % of earnings per share after taxes 484 75 58 48 46<br />
Dividend as % of free cash fl ow 484 43 41 20 28<br />
Yield, % 2.64 2.6 2.1 1.9 0.8<br />
Free cash fl ow per share5 7.28 6.93 4.94 10.26 5.45<br />
Share price at end of period 132.00 114.00 97.00 104.00 199.00<br />
Highest share price 137.00 123.00 116.00 216.50 199.00<br />
Lowest share price 106.50 86.00 69.50 104.00 130.00<br />
Average share price6 121 101.74 93.20 166.94 184.51<br />
P/E ratio7 <strong>2005</strong><br />
7.34<br />
7.31<br />
3.50<br />
18 28 28 25 61<br />
Number of shares outstanding (000s) 365,058 365,059 365,059 363,056 361,081<br />
Average number of shares outstanding, after dilution (000s) 378,712 382,409 382,417 376,690 365,123<br />
Number of shares outstanding, after dilution (000s) 375,015 382,409 382,409 382,473 365,123<br />
3<br />
484 484 2.64 7.28<br />
132.00<br />
137.00<br />
106.50<br />
121<br />
18<br />
365,058<br />
378,712<br />
375,015<br />
4.0<br />
3.5<br />
3.0<br />
2.5<br />
2.0<br />
1.5<br />
1.0<br />
0.5<br />
0.0<br />
1 After dilution. Data per share adjusted for 4:1 split in 1998 and 3:1 split in 1996.<br />
2 Adjusted for interest and tax effects attributable to convertible debenture loan; see Note 29.<br />
3 Proposed dividend.<br />
4 For <strong>2005</strong>, calculated using proposed dividend.<br />
Dividend per share<br />
Dividend per share after full taxes have increased<br />
by an average of 25 percent in the last five years.<br />
SEK<br />
01 02 03 04 05<br />
index rose by 29.4 percent. The lowest price paid for a <strong>Securitas</strong><br />
share in <strong>2005</strong> was SEK 106.50 and the highest was SEK 137.<br />
Dividend and dividend policy<br />
The Board of Directors proposes a dividend of SEK 3.50 (3.00)<br />
per share. With a free cash fl ow averaging 75-80 percent of<br />
adjusted income and a balanced growth strategy comprising<br />
both organic and acquisition-driven growth, <strong>Securitas</strong> should be<br />
able to sustain a dividend level of 40-50 percent of the annual<br />
free cash fl ow.<br />
Shareholder structure<br />
As of December 31, <strong>2005</strong> <strong>Securitas</strong> had 31,396 shareholders<br />
(29,524), an increase of 6.3 percent since 2004. The principal<br />
shareholders are Investment <strong>AB</strong> Latour, which together with<br />
Förvaltnings <strong>AB</strong> Wasatornet and SäkI <strong>AB</strong> hold 11.0 percent (11.9)<br />
of the capital and 29.7 percent (30.3) of the votes, and Melker<br />
Schörling <strong>AB</strong>, which holds 4.2 percent (4.2) of the capital and<br />
10.7 percent (10.7) of the votes. At year-end, institutional investors<br />
accounted for more than 90 percent of total share capital. Investors<br />
outside Sweden accounted for 44 percent (47) of the capital<br />
and 31 percent (33) of the votes.<br />
5 Before dilution.<br />
6 Source: Bloomberg.<br />
7 IFRS.<br />
<br />
<br />
<br />
<br />
<br />
<br />
Defi nitions<br />
Share price performance<br />
<br />
<br />
<br />
<br />
<br />
<br />
<br />
<br />
<br />
<br />
<br />
<br />
<br />
<br />
<br />
<br />
<br />
<br />
Yield: Dividend relative to share price at the end of each<br />
year. For <strong>2005</strong>, the proposed dividend is used.<br />
Free cash fl ow per share: Free cash fl ow in relation<br />
to the number of shares outstanding before dilution.<br />
P/E ratio (price/earnings): The share price at the end<br />
of each year relative to earnings per share after taxes.<br />
EBITA multiple: The company’s market capitalization and<br />
liabilities relative to operating income before amortization,<br />
net fi nancial items and taxes.<br />
Turnover rate: Turnover during the year relative to the<br />
average market capitalization during the same period.<br />
Market capitalization: The number of shares outstanding<br />
times the market price of the share price at year-end.<br />
Enterprise value: Market capitalization + net debt.<br />
32 SECURITAS <strong>2005</strong>