Thesis
Thesis
Thesis

Create successful ePaper yourself
Turn your PDF publications into a flip-book with our unique Google optimized e-Paper software.
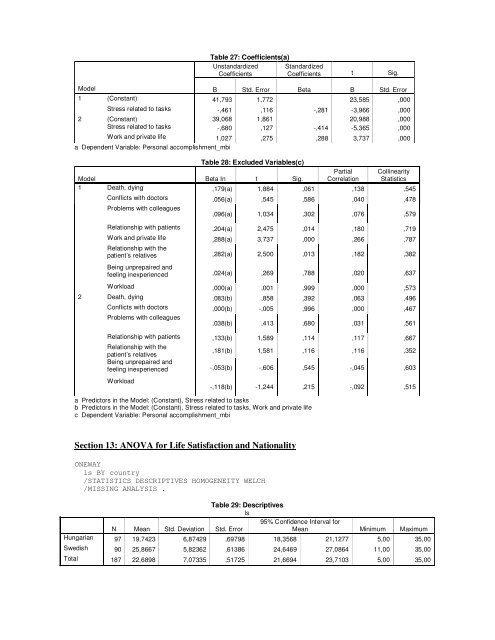
Table 27: Coefficients(a)<br />
Unstandardized<br />
Coefficients<br />
Standardized<br />
Coefficients t Sig.<br />
Model B Std. Error Beta B Std. Error<br />
1<br />
2<br />
(Constant) 41,793 1,772 23,585 ,000<br />
Stress related to tasks -,461 ,116 -,281 -3,966 ,000<br />
(Constant) 39,068 1,861 20,988 ,000<br />
Stress related to tasks -,680 ,127 -,414 -5,365 ,000<br />
Work and private life 1,027 ,275 ,288 3,737 ,000<br />
a Dependent Variable: Personal accomplishment_mbi<br />
Table 28: Excluded Variables(c)<br />
Partial Collinearity<br />
Model Beta In t Sig. Correlation Statistics<br />
1 Death, dying ,179(a) 1,884 ,061 ,138 ,545<br />
Conflicts with doctors ,056(a) ,545 ,586 ,040 ,478<br />
Problems with colleagues<br />
,096(a) 1,034 ,302 ,076 ,579<br />
Relationship with patients ,204(a) 2,475 ,014 ,180 ,719<br />
Work and private life ,288(a) 3,737 ,000 ,266 ,787<br />
Relationship with the<br />
patient’s relatives ,282(a) 2,500 ,013 ,182 ,382<br />
Being unprepaired and<br />
feeling inexperienced ,024(a) ,269 ,788 ,020 ,637<br />
Workload ,000(a) ,001 ,999 ,000 ,573<br />
2 Death, dying ,083(b) ,858 ,392 ,063 ,496<br />
Conflicts with doctors ,000(b) -,005 ,996 ,000 ,467<br />
Problems with colleagues<br />
,038(b) ,413 ,680 ,031 ,561<br />
Relationship with patients ,133(b) 1,589 ,114 ,117 ,667<br />
Relationship with the<br />
patient’s relatives<br />
,181(b) 1,581 ,116 ,116 ,352<br />
Being unprepaired and<br />
feeling inexperienced -,053(b) -,606 ,545 -,045 ,603<br />
Workload<br />
-,118(b) -1,244 ,215 -,092 ,515<br />
a Predictors in the Model: (Constant), Stress related to tasks<br />
b Predictors in the Model: (Constant), Stress related to tasks, Work and private life<br />
c Dependent Variable: Personal accomplishment_mbi<br />
Section 13: ANOVA for Life Satisfaction and Nationality<br />
ONEWAY<br />
ls BY country<br />
/STATISTICS DESCRIPTIVES HOMOGENEITY WELCH<br />
/MISSING ANALYSIS .<br />
Table 29: Descriptives<br />
ls<br />
95% Confidence Interval for<br />
N Mean Std. Deviation Std. Error<br />
Mean Minimum Maximum<br />
Hungarian 97 19,7423 6,87429 ,69798 18,3568 21,1277 5,00 35,00<br />
Swedish 90 25,8667 5,82362 ,61386 24,6469 27,0864 11,00 35,00<br />
Total 187 22,6898 7,07335 ,51725 21,6694 23,7103 5,00 35,00