Mechanisms of Olfaction in Insects - ResearchSpace@Auckland ...
Mechanisms of Olfaction in Insects - ResearchSpace@Auckland ...
Mechanisms of Olfaction in Insects - ResearchSpace@Auckland ...
You also want an ePaper? Increase the reach of your titles
YUMPU automatically turns print PDFs into web optimized ePapers that Google loves.
Identification <strong>of</strong> putative odorant receptors from Epiphyas postvittana 95<br />
curve with the follow<strong>in</strong>g thermal pr<strong>of</strong>ile; 95°C for 15 seconds, 60°C for 15 seconds,<br />
95°C for 15 seconds, with a ramp rate <strong>of</strong> 2%. The result files obta<strong>in</strong>ed from the run<br />
were loaded <strong>in</strong>to the SDS 2.1 s<strong>of</strong>tware and the amplification and dissociation curves<br />
were checked for consistency between the triplicates. Wells that had more than one<br />
peak <strong>in</strong> the dissociation curve, hence more than one PCR product were omitted from<br />
further analysis. Primer PCR efficiencies were calculated us<strong>in</strong>g the L<strong>in</strong>RegPCR<br />
(Ramakers et al., 2003) program and the Cycle Threshold (Ct) values for all the<br />
samples were converted to quantity <strong>of</strong> product formed <strong>in</strong> each sample by the<br />
follow<strong>in</strong>g equation:<br />
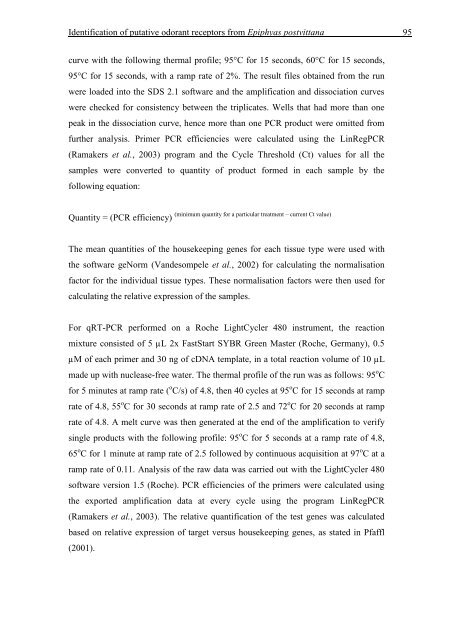
Quantity = (PCR efficiency)<br />
(m<strong>in</strong>imum quantity for a particular treatment – current Ct value)<br />
The mean quantities <strong>of</strong> the housekeep<strong>in</strong>g genes for each tissue type were used with<br />
the s<strong>of</strong>tware geNorm (Vandesompele et al., 2002) for calculat<strong>in</strong>g the normalisation<br />
factor for the <strong>in</strong>dividual tissue types. These normalisation factors were then used for<br />
calculat<strong>in</strong>g the relative expression <strong>of</strong> the samples.<br />
For qRT-PCR performed on a Roche LightCycler 480 <strong>in</strong>strument, the reaction<br />
mixture consisted <strong>of</strong> 5 µL 2x FastStart SYBR Green Master (Roche, Germany), 0.5<br />
µM <strong>of</strong> each primer and 30 ng <strong>of</strong> cDNA template, <strong>in</strong> a total reaction volume <strong>of</strong> 10 µL<br />
made up with nuclease-free water. The thermal pr<strong>of</strong>ile <strong>of</strong> the run was as follows: 95 o C<br />
for 5 m<strong>in</strong>utes at ramp rate ( o C/s) <strong>of</strong> 4.8, then 40 cycles at 95 o C for 15 seconds at ramp<br />
rate <strong>of</strong> 4.8, 55 o C for 30 seconds at ramp rate <strong>of</strong> 2.5 and 72 o C for 20 seconds at ramp<br />
rate <strong>of</strong> 4.8. A melt curve was then generated at the end <strong>of</strong> the amplification to verify<br />
s<strong>in</strong>gle products with the follow<strong>in</strong>g pr<strong>of</strong>ile: 95 o C for 5 seconds at a ramp rate <strong>of</strong> 4.8,<br />
65 o C for 1 m<strong>in</strong>ute at ramp rate <strong>of</strong> 2.5 followed by cont<strong>in</strong>uous acquisition at 97 o C at a<br />
ramp rate <strong>of</strong> 0.11. Analysis <strong>of</strong> the raw data was carried out with the LightCycler 480<br />
s<strong>of</strong>tware version 1.5 (Roche). PCR efficiencies <strong>of</strong> the primers were calculated us<strong>in</strong>g<br />
the exported amplification data at every cycle us<strong>in</strong>g the program L<strong>in</strong>RegPCR<br />
(Ramakers et al., 2003). The relative quantification <strong>of</strong> the test genes was calculated<br />
based on relative expression <strong>of</strong> target versus housekeep<strong>in</strong>g genes, as stated <strong>in</strong> Pfaffl<br />
(2001).


