Mechanisms of Olfaction in Insects - ResearchSpace@Auckland ...
Mechanisms of Olfaction in Insects - ResearchSpace@Auckland ...
Mechanisms of Olfaction in Insects - ResearchSpace@Auckland ...

You also want an ePaper? Increase the reach of your titles
YUMPU automatically turns print PDFs into web optimized ePapers that Google loves.
Functional characterisation <strong>of</strong> Epiphyas postvittana odorant receptor 1 47<br />
pIB-V5/His vector were also tested <strong>in</strong> a dose-dependent manner with the methyl<br />
salicylate and the data obta<strong>in</strong>ed is given <strong>in</strong> Appendix A.<br />
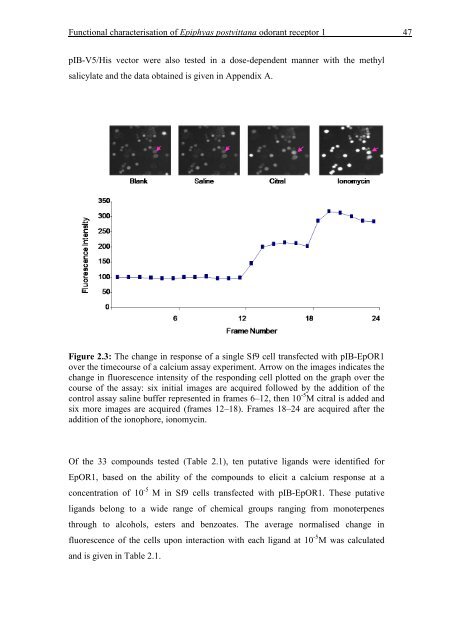
Figure 2.3: The change <strong>in</strong> response <strong>of</strong> a s<strong>in</strong>gle Sf9 cell transfected with pIB-EpOR1<br />
over the timecourse <strong>of</strong> a calcium assay experiment. Arrow on the images <strong>in</strong>dicates the<br />
change <strong>in</strong> fluorescence <strong>in</strong>tensity <strong>of</strong> the respond<strong>in</strong>g cell plotted on the graph over the<br />
course <strong>of</strong> the assay: six <strong>in</strong>itial images are acquired followed by the addition <strong>of</strong> the<br />
control assay sal<strong>in</strong>e buffer represented <strong>in</strong> frames 6–12, then 10 -5 M citral is added and<br />
six more images are acquired (frames 12–18). Frames 18–24 are acquired after the<br />
addition <strong>of</strong> the ionophore, ionomyc<strong>in</strong>.<br />
Of the 33 compounds tested (Table 2.1), ten putative ligands were identified for<br />
EpOR1, based on the ability <strong>of</strong> the compounds to elicit a calcium response at a<br />
concentration <strong>of</strong> 10 -5 M <strong>in</strong> Sf9 cells transfected with pIB-EpOR1. These putative<br />
ligands belong to a wide range <strong>of</strong> chemical groups rang<strong>in</strong>g from monoterpenes<br />
through to alcohols, esters and benzoates. The average normalised change <strong>in</strong><br />
fluorescence <strong>of</strong> the cells upon <strong>in</strong>teraction with each ligand at 10 -5 M was calculated<br />
and is given <strong>in</strong> Table 2.1.