Gamma Rays and CarbonIon-Beams Irradiation for Mutation ...
Gamma Rays and CarbonIon-Beams Irradiation for Mutation ...
Gamma Rays and CarbonIon-Beams Irradiation for Mutation ...

You also want an ePaper? Increase the reach of your titles
YUMPU automatically turns print PDFs into web optimized ePapers that Google loves.
LDNA-%<br />
LDNA-%<br />
DDP-days<br />
100<br />
80<br />
60<br />
40<br />
20<br />
100<br />
80<br />
60<br />
40<br />
20<br />
60<br />
55<br />
50<br />
45<br />
40<br />
35<br />
A<br />
1<br />
2<br />
3<br />
y = - 0 .18 0 3 x + 54 .3 17<br />
R 2 = 0 .13 6 2<br />
1<br />
2<br />
3<br />
4 5<br />
6<br />
5<br />
4<br />
6<br />
Williams<br />
y = 1.3 19 5x + 1.6 6 4 4<br />
R 2 = 0 .2 4 55<br />
25 30 35 40 45 50 55<br />
B<br />
y = - 1.9 70 6 x + 14 7.6 9<br />
R 2 = 0 .12 9 3<br />
25 30 35 40 45 50 55<br />
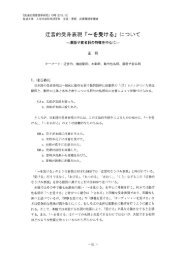
Fig. 47. LDNA-% regression versus II-% (A), LDNA-% regression<br />
versus DDP-days (B) <strong>and</strong> DDP-days regression versus II-% (C)<br />
in ‘Williams’. Values in bold triangles with the code number ‘W<br />
16 II 74’ (1), ‘W 128 I 67’(2), ‘W 1 II 148’(3), ‘W 8 II 13’(4),<br />
‘W 1 II 19’(5) <strong>and</strong> ‘W 1 II 31’(6) clearly shows relationships<br />
within the three combinations of the variables.<br />
118<br />
II-%<br />
II-%<br />
5<br />
6 4 2<br />
3<br />
38 41 44 47 50 53 56<br />
C<br />
DDP-days<br />
1