

OECD Economic Outlook 69 - Biblioteca Hegoa
OECD Economic Outlook 69 - Biblioteca Hegoa
OECD Economic Outlook 69 - Biblioteca Hegoa

You also want an ePaper? Increase the reach of your titles
YUMPU automatically turns print PDFs into web optimized ePapers that Google loves.
130 - <strong>OECD</strong> <strong>Economic</strong> <strong>Outlook</strong> <strong>69</strong><br />
… while monetary conditions<br />
remain supportive of growth<br />
GDP is projected to expand<br />
slightly above potential rates<br />
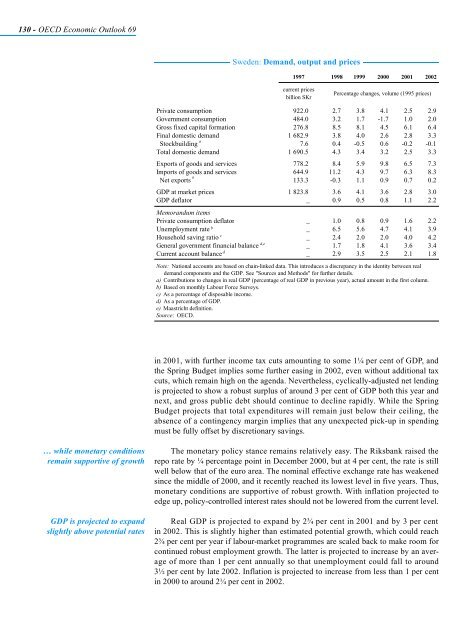
Sweden: Demand, output and prices<br />
1997 1998 1999 2000 2001 2002<br />
current prices<br />
billion SKr<br />
Percentage changes, volume (1995 prices)<br />
Private consumption 922.0 2.7 3.8 4.1 2.5 2.9<br />
Government consumption 484.0 3.2 1.7 -1.7 1.0 2.0<br />
Gross fixed capital formation 276.8 8.5 8.1 4.5 6.1 6.4<br />
Final domestic demand 1 682.9 3.8 4.0 2.6 2.8 3.3<br />
a<br />
Stockbuilding 7.6 0.4 -0.5 0.6 -0.2 -0.1<br />
Total domestic demand 1 <strong>69</strong>0.5 4.3 3.4 3.2 2.5 3.3<br />
Exports of goods and services 778.2 8.4 5.9 9.8 6.5 7.3<br />
Imports of goods and services 644.9 11.2 4.3 9.7 6.3 8.3<br />
a<br />
Net exports 133.3 -0.3 1.1 0.9 0.7 0.2<br />
GDP at market prices 1 823.8 3.6 4.1 3.6 2.8 3.0<br />
GDP deflator<br />
Memorandum items<br />
_ 0.9 0.5 0.8 1.1 2.2<br />
Private consumption deflator _ 1.0 0.8 0.9 1.6 2.2<br />
Unemployment rate b<br />
_ 6.5 5.6 4.7 4.1 3.9<br />
c<br />
Household saving ratio _ 2.4 2.0 2.0 4.0 4.2<br />
d,e<br />
General government financial balance _ 1.7 1.8 4.1 3.6 3.4<br />
d<br />
Current account balance _ 2.9 3.5 2.5 2.1 1.8<br />
Note: National accounts are based on chain-linked data. This introduces a discrepancy in the identity between real<br />
demand components and the GDP. See "Sources and Methods" for further details.<br />
a) Contributions to changes in real GDP (percentage of real GDP in previous year), actual amount in the first column.<br />
b) Based on monthly Labour Force Surveys.<br />
c) As a percentage of disposable income.<br />
d) As a percentage of GDP.<br />
e) Maastricht definition.<br />
Source: <strong>OECD</strong>.<br />
in 2001, with further income tax cuts amounting to some 1¼ per cent of GDP, and<br />
the Spring Budget implies some further easing in 2002, even without additional tax<br />
cuts, which remain high on the agenda. Nevertheless, cyclically-adjusted net lending<br />
is projected to show a robust surplus of around 3 per cent of GDP both this year and<br />
next, and gross public debt should continue to decline rapidly. While the Spring<br />
Budget projects that total expenditures will remain just below their ceiling, the<br />
absence of a contingency margin implies that any unexpected pick-up in spending<br />
must be fully offset by discretionary savings.<br />
The monetary policy stance remains relatively easy. The Riksbank raised the<br />
repo rate by ¼ percentage point in December 2000, but at 4 per cent, the rate is still<br />
well below that of the euro area. The nominal effective exchange rate has weakened<br />
since the middle of 2000, and it recently reached its lowest level in five years. Thus,<br />
monetary conditions are supportive of robust growth. With inflation projected to<br />
edge up, policy-controlled interest rates should not be lowered from the current level.<br />
Real GDP is projected to expand by 2¾ per cent in 2001 and by 3 per cent<br />
in 2002. This is slightly higher than estimated potential growth, which could reach<br />
2¾ per cent per year if labour-market programmes are scaled back to make room for<br />
continued robust employment growth. The latter is projected to increase by an average<br />
of more than 1 per cent annually so that unemployment could fall to around<br />
3½ per cent by late 2002. Inflation is projected to increase from less than 1 per cent<br />
in 2000 to around 2¼ per cent in 2002.


