

OECD Economic Outlook 69 - Biblioteca Hegoa
OECD Economic Outlook 69 - Biblioteca Hegoa
OECD Economic Outlook 69 - Biblioteca Hegoa

You also want an ePaper? Increase the reach of your titles
YUMPU automatically turns print PDFs into web optimized ePapers that Google loves.
214 - <strong>OECD</strong> <strong>Economic</strong> <strong>Outlook</strong> <strong>69</strong><br />
The decomposition of labour<br />
productivity growth in service<br />
sectors is more varied<br />
growth than on average, 8 suggesting an important role for new (high-tech) firms in<br />
an area characterised by a strong wave of technological changes. The opposite seems<br />
to be the case in more mature industries, where a more significant contribution<br />
comes from either within-firm growth or the exit of obsolete firms.<br />
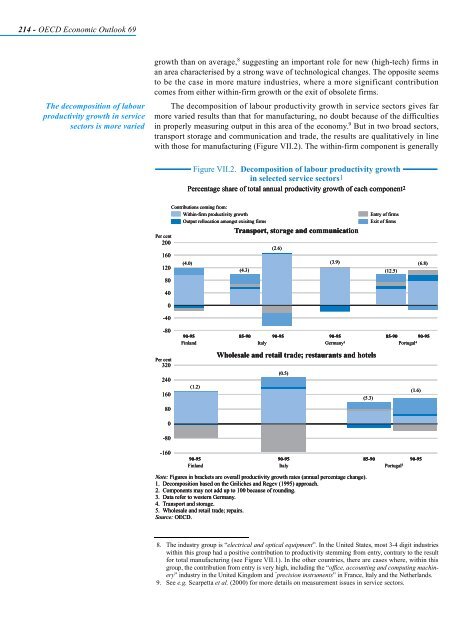
The decomposition of labour productivity growth in service sectors gives far<br />
more varied results than that for manufacturing, no doubt because of the difficulties<br />
in properly measuring output in this area of the economy. 9 But in two broad sectors,<br />
transport storage and communication and trade, the results are qualitatively in line<br />
with those for manufacturing (Figure VII.2). The within-firm component is generally<br />
Per cent<br />
200<br />
160<br />
120<br />
80<br />
40<br />
0<br />
-40<br />
-80<br />
Per cent<br />
320<br />
240<br />
160<br />
80<br />
0<br />
-80<br />
-160<br />
Figure VII.2. Decomposition of labour productivity growth<br />
in selected service sectors1 sectors1 sectors1<br />
Percentage share of total annual productivity growth of each component2 component2 component2<br />
Contributions coming from:<br />
Within-firm productivity growth<br />
Output rellocation amongst exisitng firms<br />
(4.0)<br />
(4.3)<br />
90-95 85-90 90-95<br />
90-95 85-90 90-95<br />
Finland Italy<br />
Germany3 Portugal4 90-95 85-90 90-95<br />
90-95 85-90 90-95<br />
Finland Italy<br />
Germany3 Portugal4 90-95 85-90 90-95<br />
90-95 85-90 90-95<br />
Finland Italy<br />
Germany3 Portugal4 (1.2)<br />
Transport, storage and communication<br />
(2.6)<br />
(0.5)<br />
8. The industry group is “electrical and optical equipment”. In the United States, most 3-4 digit industries<br />
within this group had a positive contribution to productivity stemming from entry, contrary to the result<br />
for total manufacturing (see Figure VII.1). In the other countries, there are cases where, within this<br />
group, the contribution from entry is very high, including the “office, accounting and computing machinery”<br />
industry in the United Kingdom and “ precision instruments” in France, Italy and the Netherlands.<br />
9. See e.g. Scarpetta et al. (2000) for more details on measurement issues in service sectors.<br />
(3.9)<br />
Wholesale and retail trade; restaurants and hotels<br />
(5.3)<br />
(12.5)<br />
(1.6)<br />
90-95<br />
90-95 85-90 90-95<br />
Finland Italy Portugal5 90-95<br />
90-95 85-90 90-95<br />
Finland Italy Portugal5 90-95<br />
90-95 85-90 90-95<br />
Finland Italy Portugal5 Note: Figures in brackets are overall productivity growth rates (annual percentage change).<br />
1. Decomposition based on the Griliches and Regev (1995) approach.<br />
2. Components may not add up to 100 because of rounding.<br />
3. Data refer to western Germany.<br />
4. Transport and storage.<br />
5. Wholesale and retail trade; repairs.<br />
Source: <strong>OECD</strong>.<br />
Entry of firms<br />
Exit of firms<br />
(6.8)


