

OECD Economic Outlook 69 - Biblioteca Hegoa
OECD Economic Outlook 69 - Biblioteca Hegoa
OECD Economic Outlook 69 - Biblioteca Hegoa

You also want an ePaper? Increase the reach of your titles
YUMPU automatically turns print PDFs into web optimized ePapers that Google loves.
284 - <strong>OECD</strong> <strong>Economic</strong> <strong>Outlook</strong> <strong>69</strong><br />
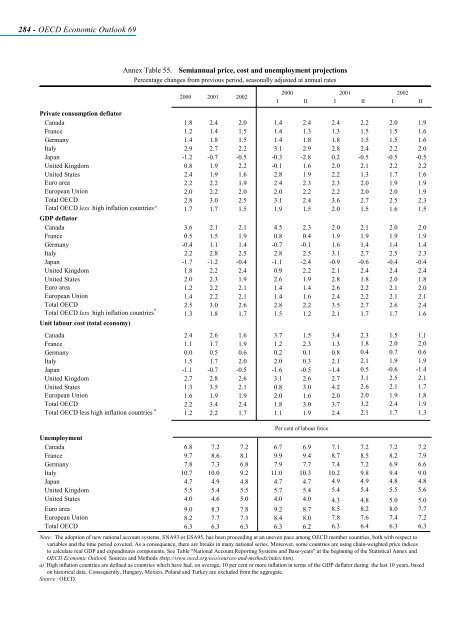
Annex Table 55. Semiannual price, cost and unemployment projections<br />
Percentage changes from previous period, seasonally adjusted at annual rates<br />
2000 2001 2002<br />
2000 2001 2002<br />
I II I II I II<br />
Private consumption deflator<br />
Canada 1.8 2.4 2.0 1.4 2.4 2.4 2.2 2.0 1.9<br />
France 1.2 1.4 1.5 1.4 1.3 1.3 1.5 1.5 1.6<br />
Germany 1.4 1.8 1.5 1.4 1.8 1.8 1.5 1.5 1.6<br />
Italy 2.9 2.7 2.2 3.1 2.9 2.8 2.4 2.2 2.0<br />
Japan -1.2 -0.7 -0.5 -0.3 -2.8 0.2 -0.5 -0.5 -0.5<br />
United Kingdom 0.8 1.9 2.2 -0.1 1.6 2.0 2.1 2.2 2.2<br />
United States 2.4 1.9 1.6 2.8 1.9 2.2 1.3 1.7 1.6<br />
Euro area 2.2 2.2 1.9 2.4 2.3 2.3 2.0 1.9 1.9<br />
European Union 2.0 2.2 2.0 2.0 2.2 2.2 2.0 2.0 1.9<br />
Total <strong>OECD</strong> 2.8 3.0 2.5 3.1 2.4 3.6 2.7 2.5 2.3<br />
a<br />
Total <strong>OECD</strong> less high inflation countries<br />
GDP deflator<br />
1.7 1.7 1.5 1.9 1.5 2.0 1.5 1.6 1.5<br />
Canada 3.6 2.1 2.1 4.5 2.3 2.0 2.1 2.0 2.0<br />
France 0.5 1.5 1.9 0.8 0.4 1.9 1.9 1.9 1.9<br />
Germany -0.4 1.1 1.4 -0.7 -0.1 1.6 1.4 1.4 1.4<br />
Italy 2.2 2.8 2.5 2.8 2.5 3.1 2.7 2.5 2.3<br />
Japan -1.7 -1.2 -0.4 -1.1 -2.4 -0.9 -0.6 -0.4 -0.4<br />
United Kingdom 1.8 2.2 2.4 0.9 2.2 2.1 2.4 2.4 2.4<br />
United States 2.0 2.3 1.9 2.6 1.9 2.8 1.8 2.0 1.8<br />
Euro area 1.2 2.2 2.1 1.4 1.4 2.6 2.2 2.1 2.0<br />
European Union 1.4 2.2 2.1 1.4 1.6 2.4 2.2 2.1 2.1<br />
Total <strong>OECD</strong><br />
a<br />
Total <strong>OECD</strong> less high inflation countries<br />
Unit labour cost (total economy)<br />
2.5<br />
1.3<br />
3.0<br />
1.8<br />
2.6<br />
1.7<br />
2.8<br />
1.5<br />
2.2<br />
1.2<br />
3.5<br />
2.1<br />
2.7<br />
1.7<br />
2.6<br />
1.7<br />
2.4<br />
1.6<br />
Canada 2.4 2.6 1.6 3.7 1.5 3.4 2.3 1.5 1.1<br />
France 1.1 1.7 1.9 1.2 2.3 1.3 1.8 2.0 2.0<br />
Germany 0.0 0.5 0.6 0.2 0.1 0.8 0.4 0.7 0.6<br />
Italy 1.5 1.7 2.0 2.0 0.3 2.1 2.1 1.9 1.9<br />
Japan -1.1 -0.7 -0.5 -1.6 -0.5 -1.4 0.5 -0.6 -1.4<br />
United Kingdom 2.7 2.8 2.6 3.1 2.6 2.7 3.1 2.5 2.1<br />
United States 1.3 3.5 2.1 0.8 3.0 4.2 2.6 2.1 1.7<br />
European Union 1.6 1.9 1.9 2.0 1.6 2.0 2.0 1.9 1.8<br />
Total <strong>OECD</strong> 2.2 3.4 2.4 1.8 3.0 3.7 3.2 2.4 1.9<br />
a<br />
Total <strong>OECD</strong> less high inflation countries 1.2 2.2 1.7 1.1 1.9 2.4 2.1 1.7 1.3<br />
Per cent of labour force<br />
Unemployment<br />
Canada 6.8 7.2 7.2 6.7 6.9 7.1 7.2 7.2 7.2<br />
France 9.7 8.6 8.1 9.9 9.4 8.7 8.5 8.2 7.9<br />
Germany 7.8 7.3 6.8 7.9 7.7 7.4 7.2 6.9 6.6<br />
Italy 10.7 10.0 9.2 11.0 10.3 10.2 9.8 9.4 9.0<br />
Japan 4.7 4.9 4.8 4.7 4.7 4.9 4.9 4.8 4.8<br />
United Kingdom 5.5 5.4 5.5 5.7 5.4 5.4 5.4 5.5 5.6<br />
United States 4.0 4.6 5.0 4.0 4.0 4.3 4.8 5.0 5.0<br />
Euro area 9.0 8.3 7.8 9.2 8.7 8.5 8.2 8.0 7.7<br />
European Union 8.2 7.7 7.3 8.4 8.0 7.8 7.6 7.4 7.2<br />
Total <strong>OECD</strong> 6.3 6.3 6.3 6.3 6.2 6.3 6.4 6.3 6.3<br />
Note: The adoption of new national account systems, SNA93 or ESA95, has been proceeding at an uneven pace among <strong>OECD</strong> member countries, both with respect to<br />
variables and the time period covered. As a consequence, there are breaks in many national series. Moreover, some countries are using chain-weighted price indices<br />
to calculate real GDP and expenditures components. See Table "National Account Reporting Systems and Base-years" at the beginning of the Statistical Annex and<br />
<strong>OECD</strong> <strong>Economic</strong> <strong>Outlook</strong> Sources and Methods (http://www.oecd.org/eco/sources-and-methods/index.htm).<br />
a) High inflation countries are defined as countries which have had, on average, 10 per cent or more inflation in terms of the GDP deflator during the last 10 years, based<br />
on historical data. Consequently, Hungary, Mexico, Poland and Turkey are excluded from the aggregate.<br />
Source :<strong>OECD</strong>.


