

OECD Economic Outlook 69 - Biblioteca Hegoa
OECD Economic Outlook 69 - Biblioteca Hegoa
OECD Economic Outlook 69 - Biblioteca Hegoa

Create successful ePaper yourself
Turn your PDF publications into a flip-book with our unique Google optimized e-Paper software.
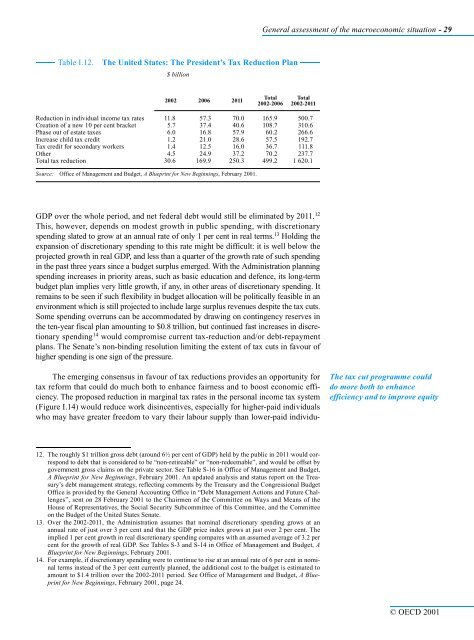
Table I.12. The United States: The President’s Tax Reduction Plan<br />
$ billion<br />
2002 2006 2011<br />
GDP over the whole period, and net federal debt would still be eliminated by 2011. 12<br />
This, however, depends on modest growth in public spending, with discretionary<br />
spending slated to grow at an annual rate of only 1 per cent in real terms. 13 Holding the<br />
expansion of discretionary spending to this rate might be difficult: it is well below the<br />
projected growth in real GDP, and less than a quarter of the growth rate of such spending<br />
in the past three years since a budget surplus emerged. With the Administration planning<br />
spending increases in priority areas, such as basic education and defence, its long-term<br />
budget plan implies very little growth, if any, in other areas of discretionary spending. It<br />
remains to be seen if such flexibility in budget allocation will be politically feasible in an<br />
environment which is still projected to include large surplus revenues despite the tax cuts.<br />
Some spending overruns can be accommodated by drawing on contingency reserves in<br />
the ten-year fiscal plan amounting to $0.8 trillion, but continued fast increases in discretionary<br />
spending 14 would compromise current tax-reduction and/or debt-repayment<br />
plans. The Senate’s non-binding resolution limiting the extent of tax cuts in favour of<br />
higher spending is one sign of the pressure.<br />
The emerging consensus in favour of tax reductions provides an opportunity for<br />
tax reform that could do much both to enhance fairness and to boost economic efficiency.<br />
The proposed reduction in marginal tax rates in the personal income tax system<br />
(Figure I.14) would reduce work disincentives, especially for higher-paid individuals<br />
who may have greater freedom to vary their labour supply than lower-paid individu-<br />
12. The roughly $1 trillion gross debt (around 6½ per cent of GDP) held by the public in 2011 would correspond<br />
to debt that is considered to be “non-retireable” or “non-redeemable”, and would be offset by<br />
government gross claims on the private sector. See Table S-16 in Office of Management and Budget,<br />
A Blueprint for New Beginnings, February 2001. An updated analysis and status report on the Treasury’s<br />
debt management strategy, reflecting comments by the Treasury and the Congressional Budget<br />
Office is provided by the General Accounting Office in “Debt Management Actions and Future Challenges”,<br />
sent on 28 February 2001 to the Chairmen of the Committee on Ways and Means of the<br />
House of Representatives, the Social Security Subcommittee of this Committee, and the Committee<br />
on the Budget of the United States Senate.<br />
13. Over the 2002-2011, the Administration assumes that nominal discretionary spending grows at an<br />
annual rate of just over 3 per cent and that the GDP price index grows at just over 2 per cent. The<br />
implied 1 per cent growth in real discretionary spending compares with an assumed average of 3.2 per<br />
cent for the growth of real GDP. See Tables S-3 and S-14 in Office of Management and Budget, A<br />
Blueprint for New Beginnings, February 2001.<br />
14. For example, if discretionary spending were to continue to rise at an annual rate of 6 per cent in nominal<br />
terms instead of the 3 per cent currently planned, the additional cost to the budget is estimated to<br />
amount to $1.4 trillion over the 2002-2011 period. See Office of Management and Budget, A Blueprint<br />
for New Beginnings, February 2001, page 24.<br />
General assessment of the macroeconomic situation - 29<br />
Total<br />
2002-2006<br />
Total<br />
2002-2011<br />
Reduction in individual income tax rates 11.8 57.3 70.0 165.9 500.7<br />
Creation of a new 10 per cent bracket 5.7 37.4 40.6 108.7 310.6<br />
Phase out of estate taxes 6.0 16.8 57.9 60.2 266.6<br />
Increase child tax credit 1.2 21.0 28.6 57.5 192.7<br />
Tax credit for secondary workers 1.4 12.5 16.0 36.7 111.8<br />
Other 4.5 24.9 37.2 70.2 237.7<br />
Total tax reduction 30.6 1<strong>69</strong>.9 250.3 499.2 1 620.1<br />
Source: Office of Management and Budget, A Blueprint for New Beginnings, February 2001.<br />
The tax cut programme could<br />
do more both to enhance<br />
efficiency and to improve equity<br />
© <strong>OECD</strong> 2001


