

OECD Economic Outlook 69 - Biblioteca Hegoa
OECD Economic Outlook 69 - Biblioteca Hegoa
OECD Economic Outlook 69 - Biblioteca Hegoa

You also want an ePaper? Increase the reach of your titles
YUMPU automatically turns print PDFs into web optimized ePapers that Google loves.
© <strong>OECD</strong> 2001<br />
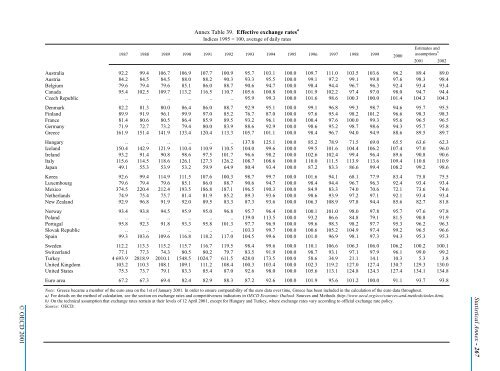
Annex Table 39. Effective exchangerates a<br />
Indices 1995 = 100, average of daily rates<br />
1987 1988 1989 1990 1991 1992 1993 1994 1995 1996 1997 1998 1999<br />
Estimates and<br />
assumptions<br />
2001 2002<br />
b<br />
Australia 92.2 99.4 106.7 106.9 107.7 100.9 95.7 103.1 100.0 109.7 111.0 103.5 103.6 96.2 89.4 89.0<br />
Austria 84.2 84.5 84.5 88.0 88.2 90.3 93.3 95.5 100.0 99.1 97.2 99.1 99.8 97.6 98.3 98.4<br />
Belgium 79.6 79.4 79.6 85.1 86.0 88.7 90.6 94.7 100.0 98.4 94.4 96.7 96.3 92.4 93.4 93.4<br />
Canada 95.4 102.5 109.7 113.2 116.5 110.7 105.6 100.8 100.0 101.9 102.2 97.4 97.0 98.0 94.7 94.4<br />
Czech Republic .. .. .. .. .. .. 95.9 99.3 100.0 101.6 98.6 100.3 100.0 101.4 104.3 104.3<br />
Denmark 82.2 81.3 80.0 86.4 86.0 88.7 92.9 95.1 100.0 99.1 96.8 99.3 98.7 94.6 95.7 95.5<br />
Finland 89.9 91.9 96.1 99.9 97.0 85.2 76.7 87.0 100.0 97.6 95.4 98.2 101.2 96.6 98.3 98.3<br />
France 81.4 80.6 80.5 86.4 85.9 89.5 93.2 96.1 100.0 100.4 97.6 100.0 99.3 95.6 96.5 96.5<br />
Germany 71.9 72.7 73.2 79.4 80.0 83.9 88.6 92.9 100.0 98.6 95.2 98.7 98.6 94.3 95.7 95.8<br />
Greece 161.9 151.4 141.9 133.4 120.4 113.3 105.7 101.1 100.0 98.4 96.7 94.0 94.9 88.6 89.5 89.7<br />
Hungary .. .. .. .. .. .. 137.8 125.1 100.0 85.2 78.9 71.5 <strong>69</strong>.0 65.5 63.6 62.3<br />
Iceland 150.4 142.9 121.9 110.4 110.9 110.5 104.0 99.6 100.0 99.5 101.6 104.4 106.2 107.4 97.0 96.0<br />
Ireland 93.2 91.4 90.8 98.6 97.5 101.7 96.6 98.2 100.0 102.6 102.4 99.4 96.4 89.6 90.8 90.6<br />
Italy 115.6 114.5 118.6 126.1 127.3 126.2 108.7 108.6 100.0 110.0 111.5 113.9 113.6 109.4 110.8 110.9<br />
Japan 49.1 55.3 53.9 53.2 59.9 64.9 80.4 93.4 100.0 87.2 83.3 86.6 99.4 108.2 99.2 98.6<br />
Korea 92.6 99.4 114.9 111.5 107.6 100.3 98.7 99.7 100.0 101.6 94.1 68.1 77.9 83.4 75.8 75.5<br />
Luxembourg 79.6 79.4 79.6 85.1 86.0 88.7 90.6 94.7 100.0 98.4 94.4 96.7 96.3 92.4 93.4 93.4<br />
Mexico 374.5 220.4 212.4 193.5 186.8 187.1 196.5 190.3 100.0 84.9 83.3 74.0 70.6 72.1 73.6 74.6<br />
Netherlands 74.9 75.4 75.7 81.4 81.9 85.2 89.3 93.6 100.0 98.6 93.9 97.2 97.1 92.1 93.4 93.4<br />
New Zealand 92.9 96.8 91.9 92.0 89.5 83.3 87.3 93.6 100.0 106.3 108.9 97.8 94.4 85.6 82.7 81.8<br />
Norway 93.4 93.8 94.5 95.9 95.0 96.8 95.7 96.4 100.0 100.1 101.0 98.0 97.8 95.7 97.6 97.8<br />
Poland .. .. .. .. .. .. 139.0 113.5 100.0 93.2 86.6 84.8 79.1 81.5 90.8 91.9<br />
Portugal 95.8 92.3 91.8 93.3 95.8 101.3 97.7 96.9 100.0 99.6 98.3 98.2 97.7 95.3 96.2 96.3<br />
Slovak Republic .. .. .. .. .. .. 103.3 99.7 100.0 100.6 105.2 104.9 97.4 99.2 96.5 96.6<br />
Spain 99.3 103.6 109.6 116.8 118.2 117.0 104.5 99.6 100.0 101.0 96.9 98.1 97.3 94.3 95.3 95.3<br />
Sweden 112.2 113.3 115.2 115.7 116.7 119.5 98.4 99.6 100.0 110.1 106.6 106.3 106.0 106.2 100.2 100.1<br />
Switzerland 77.1 77.3 74.3 80.5 80.2 79.7 83.5 91.9 100.0 98.7 93.1 97.1 97.9 96.1 99.0 99.2<br />
Turkey 4 <strong>69</strong>3.9 2818.9 2010.1 1548.5 1024.7 611.5 428.0 173.5 100.0 58.6 34.9 21.1 14.1 10.3 5.3 3.8<br />
United Kingdom 103.2 110.3 108.1 109.1 111.2 108.4 100.3 103.4 100.0 102.3 119.2 127.0 127.4 130.7 129.3 130.0<br />
United States 75.3 73.7 79.1 83.3 85.4 87.0 92.6 98.0 100.0 105.6 113.1 124.8 124.3 127.4 134.1 134.8<br />
Euro area 67.2 67.3 <strong>69</strong>.4 82.4 82.9 88.3 87.2 92.6 100.0 101.9 95.6 101.2 100.0 91.1 93.7 93.8<br />
Note: Greece became a member of the euro area on the 1st of January 2001. In order to ensure comparability of the euro data over time, Greece has been included in the calculation of the euro data throughout.<br />
a) For details on the method of calculation, see the section on exchange rates and competitiveness indicators in <strong>OECD</strong> <strong>Economic</strong> <strong>Outlook</strong> Sources and Methods (http://www.oecd.org/eco/sources-and-methods/index.htm).<br />
b) On the technical assumption that exchange rates remain at their levels of 12 April 2001, except for Hungary and Turkey, where exchange rates vary according to official exchange rate policy.<br />
Source: <strong>OECD</strong>.<br />
2000<br />
Statistical Annex - 267


