

OECD Economic Outlook 69 - Biblioteca Hegoa
OECD Economic Outlook 69 - Biblioteca Hegoa
OECD Economic Outlook 69 - Biblioteca Hegoa

You also want an ePaper? Increase the reach of your titles
YUMPU automatically turns print PDFs into web optimized ePapers that Google loves.
Potential GDP growth<br />
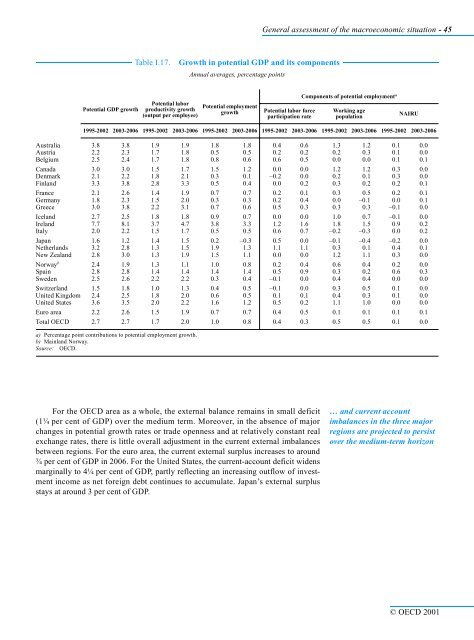
Table I.17. Growth in potential GDP and its components<br />
Potential labor<br />
productivity growth<br />
(output per employee)<br />
Annual averages, percentage points<br />
Potential employment<br />
growth<br />
For the <strong>OECD</strong> area as a whole, the external balance remains in small deficit<br />
(1¼ per cent of GDP) over the medium term. Moreover, in the absence of major<br />
changes in potential growth rates or trade openness and at relatively constant real<br />
exchange rates, there is little overall adjustment in the current external imbalances<br />
between regions. For the euro area, the current external surplus increases to around<br />
¾ per cent of GDP in 2006. For the United States, the current-account deficit widens<br />
marginally to 4¼ per cent of GDP, partly reflecting an increasing outflow of investment<br />
income as net foreign debt continues to accumulate. Japan’s external surplus<br />
stays at around 3 per cent of GDP.<br />
General assessment of the macroeconomic situation - 45<br />
Potential labor force<br />
participation rate<br />
Components of potential employment a<br />
Working age<br />
population<br />
NAIRU<br />
1995-2002 2003-2006 1995-2002 2003-2006 1995-2002 2003-2006 1995-2002 2003-2006 1995-2002 2003-2006 1995-2002 2003-2006<br />
Australia 3.8 3.8 1.9 1.9 1.8 1.8 0.4 0.6 1.3 1.2 0.1 0.0<br />
Austria 2.2 2.3 1.7 1.8 0.5 0.5 0.2 0.2 0.2 0.3 0.1 0.0<br />
Belgium 2.5 2.4 1.7 1.8 0.8 0.6 0.6 0.5 0.0 0.0 0.1 0.1<br />
Canada 3.0 3.0 1.5 1.7 1.5 1.2 0.0 0.0 1.2 1.2 0.3 0.0<br />
Denmark 2.1 2.2 1.8 2.1 0.3 0.1 –0.2 0.0 0.2 0.1 0.3 0.0<br />
Finland 3.3 3.8 2.8 3.3 0.5 0.4 0.0 0.2 0.3 0.2 0.2 0.1<br />
France 2.1 2.6 1.4 1.9 0.7 0.7 0.2 0.1 0.3 0.5 0.2 0.1<br />
Germany 1.8 2.3 1.5 2.0 0.3 0.3 0.2 0.4 0.0 –0.1 0.0 0.1<br />
Greece 3.0 3.8 2.2 3.1 0.7 0.6 0.5 0.3 0.3 0.3 –0.1 0.0<br />
Iceland 2.7 2.5 1.8 1.8 0.9 0.7 0.0 0.0 1.0 0.7 –0.1 0.0<br />
Ireland 7.7 8.1 3.7 4.7 3.8 3.3 1.2 1.6 1.8 1.5 0.9 0.2<br />
Italy 2.0 2.2 1.5 1.7 0.5 0.5 0.6 0.7 –0.2 –0.3 0.0 0.2<br />
Japan 1.6 1.2 1.4 1.5 0.2 –0.3 0.5 0.0 –0.1 –0.4 –0.2 0.0<br />
Netherlands 3.2 2.8 1.3 1.5 1.9 1.3 1.1 1.1 0.3 0.1 0.4 0.1<br />
New Zealand 2.8 3.0 1.3 1.9 1.5 1.1 0.0 0.0 1.2 1.1 0.3 0.0<br />
Norway b 2.4 1.9 1.3 1.1 1.0 0.8 0.2 0.4 0.6 0.4 0.2 0.0<br />
Spain 2.8 2.8 1.4 1.4 1.4 1.4 0.5 0.9 0.3 0.2 0.6 0.3<br />
Sweden 2.5 2.6 2.2 2.2 0.3 0.4 –0.1 0.0 0.4 0.4 0.0 0.0<br />
Switzerland 1.5 1.8 1.0 1.3 0.4 0.5 –0.1 0.0 0.3 0.5 0.1 0.0<br />
United Kingdom 2.4 2.5 1.8 2.0 0.6 0.5 0.1 0.1 0.4 0.3 0.1 0.0<br />
United States 3.6 3.5 2.0 2.2 1.6 1.2 0.5 0.2 1.1 1.0 0.0 0.0<br />
Euro area 2.2 2.6 1.5 1.9 0.7 0.7 0.4 0.5 0.1 0.1 0.1 0.1<br />
Total <strong>OECD</strong> 2.7 2.7 1.7 2.0 1.0 0.8 0.4 0.3 0.5 0.5 0.1 0.0<br />
a) Percentage point contributions to potential employment growth.<br />
b) Mainland Norway.<br />
Source: <strong>OECD</strong>.<br />
… and current account<br />
imbalances in the three major<br />
regions are projected to persist<br />
over the medium-term horizon<br />
© <strong>OECD</strong> 2001


