

OECD Economic Outlook 69 - Biblioteca Hegoa
OECD Economic Outlook 69 - Biblioteca Hegoa
OECD Economic Outlook 69 - Biblioteca Hegoa

Create successful ePaper yourself
Turn your PDF publications into a flip-book with our unique Google optimized e-Paper software.
290 - <strong>OECD</strong> <strong>Economic</strong> <strong>Outlook</strong> <strong>69</strong><br />
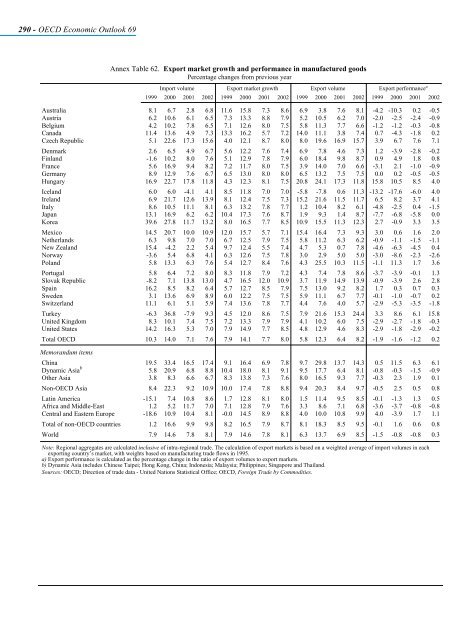
Annex Table 62. Export market growth and performance in manufactured goods<br />
Percentage changes from previous year<br />
Import volume Export market growth Export volume Export performance a<br />
1999 2000 2001 2002 1999 2000 2001 2002 1999 2000 2001 2002 1999 2000 2001 2002<br />
Australia 8.1 6.7 2.8 6.8 11.6 15.8 7.3 8.6 6.9 3.8 7.6 8.1 -4.2 -10.3 0.2 -0.5<br />
Austria 6.2 10.6 6.1 6.5 7.3 13.3 8.8 7.9 5.2 10.5 6.2 7.0 -2.0 -2.5 -2.4 -0.9<br />
Belgium 4.2 10.2 7.8 6.5 7.1 12.6 8.0 7.5 5.8 11.3 7.7 6.6 -1.2 -1.2 -0.3 -0.8<br />
Canada 11.4 13.6 4.9 7.3 13.3 16.2 5.7 7.2 14.0 11.1 3.8 7.4 0.7 -4.3 -1.8 0.2<br />
Czech Republic 5.1 22.6 17.3 15.6 4.0 12.1 8.7 8.0 8.0 19.6 16.9 15.7 3.9 6.7 7.6 7.1<br />
Denmark 2.6 6.5 4.9 6.7 5.6 12.2 7.6 7.4 6.9 7.8 4.6 7.3 1.2 -3.9 -2.8 -0.2<br />
Finland -1.6 10.2 8.0 7.6 5.1 12.9 7.8 7.9 6.0 18.4 9.8 8.7 0.9 4.9 1.8 0.8<br />
France 5.6 16.9 9.4 8.2 7.2 11.7 8.0 7.5 3.9 14.0 7.0 6.6 -3.1 2.1 -1.0 -0.9<br />
Germany 8.9 12.9 7.6 6.7 6.5 13.0 8.0 8.0 6.5 13.2 7.5 7.5 0.0 0.2 -0.5 -0.5<br />
Hungary 16.9 22.7 17.8 11.8 4.3 12.3 8.1 7.5 20.8 24.1 17.3 11.8 15.8 10.5 8.5 4.0<br />
Iceland 6.0 6.0 -4.1 4.1 8.5 11.8 7.0 7.0 -5.8 -7.8 0.6 11.3 -13.2 -17.6 -6.0 4.0<br />
Ireland 6.9 21.7 12.6 13.9 8.1 12.4 7.5 7.3 15.2 21.6 11.5 11.7 6.5 8.2 3.7 4.1<br />
Italy 8.6 10.5 11.1 8.1 6.3 13.2 7.8 7.7 1.2 10.4 8.2 6.1 -4.8 -2.5 0.4 -1.5<br />
Japan 13.1 16.9 6.2 6.2 10.4 17.3 7.6 8.7 1.9 9.3 1.4 8.7 -7.7 -6.8 -5.8 0.0<br />
Korea 39.6 27.8 11.7 13.2 8.0 16.5 7.7 8.5 10.9 15.5 11.3 12.3 2.7 -0.9 3.3 3.5<br />
Mexico 14.5 20.7 10.0 10.9 12.0 15.7 5.7 7.1 15.4 16.4 7.3 9.3 3.0 0.6 1.6 2.0<br />
Netherlands 6.3 9.8 7.0 7.0 6.7 12.5 7.9 7.5 5.8 11.2 6.3 6.2 -0.9 -1.1 -1.5 -1.1<br />
New Zealand 15.4 -4.2 2.2 5.4 9.7 12.4 5.5 7.4 4.7 5.3 0.7 7.8 -4.6 -6.3 -4.5 0.4<br />
Norway -3.6 5.4 6.8 4.1 6.3 12.6 7.5 7.8 3.0 2.9 5.0 5.0 -3.0 -8.6 -2.3 -2.6<br />
Poland 5.8 13.3 6.3 7.6 5.4 12.7 8.4 7.6 4.3 25.5 10.3 11.5 -1.1 11.3 1.7 3.6<br />
Portugal 5.8 6.4 7.2 8.0 8.3 11.8 7.9 7.2 4.3 7.4 7.8 8.6 -3.7 -3.9 -0.1 1.3<br />
Slovak Republic -8.2 7.1 13.8 13.0 4.7 16.5 12.0 10.9 3.7 11.9 14.9 13.9 -0.9 -3.9 2.6 2.8<br />
Spain 16.2 8.5 8.2 6.4 5.7 12.7 8.5 7.9 7.5 13.0 9.2 8.2 1.7 0.3 0.7 0.3<br />
Sweden 3.1 13.6 6.9 8.9 6.0 12.2 7.5 7.5 5.9 11.1 6.7 7.7 -0.1 -1.0 -0.7 0.2<br />
Switzerland 11.1 6.1 5.1 5.9 7.4 13.6 7.8 7.7 4.4 7.6 4.0 5.7 -2.9 -5.3 -3.5 -1.8<br />
Turkey -6.3 36.8 -7.9 9.3 4.5 12.0 8.6 7.5 7.9 21.6 15.3 24.4 3.3 8.6 6.1 15.8<br />
United Kingdom 8.3 10.1 7.4 7.5 7.2 13.3 7.9 7.9 4.1 10.2 6.0 7.5 -2.9 -2.7 -1.8 -0.3<br />
United States 14.2 16.3 5.3 7.0 7.9 14.9 7.7 8.5 4.8 12.9 4.6 8.3 -2.9 -1.8 -2.9 -0.2<br />
Total <strong>OECD</strong> 10.3 14.0 7.1 7.6 7.9 14.1 7.7 8.0 5.8 12.3 6.4 8.2 -1.9 -1.6 -1.2 0.2<br />
Memorandum items<br />
China<br />
Dynamic Asia<br />
19.5 33.4 16.5 17.4 9.1 16.4 6.9 7.8 9.7 29.8 13.7 14.3 0.5 11.5 6.3 6.1<br />
b<br />
5.8 20.9 6.8 8.8 10.4 18.0 8.1 9.1 9.5 17.7 6.4 8.1 -0.8 -0.3 -1.5 -0.9<br />
Other Asia 3.8 8.3 6.6 6.7 8.3 13.8 7.3 7.6 8.0 16.5 9.3 7.7 -0.3 2.3 1.9 0.1<br />
Non-<strong>OECD</strong> Asia 8.4 22.3 9.2 10.9 10.0 17.4 7.8 8.8 9.4 20.3 8.4 9.7 -0.5 2.5 0.5 0.8<br />
Latin America -15.1 7.4 10.8 8.6 1.7 12.8 8.1 8.0 1.5 11.4 9.5 8.5 -0.1 -1.3 1.3 0.5<br />
Africa and Middle-East 1.2 5.2 11.7 7.0 7.1 12.8 7.9 7.6 3.3 8.6 7.1 6.8 -3.6 -3.7 -0.8 -0.8<br />
Central and Eastern Europe -18.6 10.9 10.4 8.1 -0.0 14.5 8.9 8.8 4.0 10.0 10.8 9.9 4.0 -3.9 1.7 1.1<br />
Total of non-<strong>OECD</strong> countries 1.2 16.6 9.9 9.8 8.2 16.5 7.9 8.7 8.1 18.3 8.5 9.5 -0.1 1.6 0.6 0.8<br />
World 7.9 14.6 7.8 8.1 7.9 14.6 7.8 8.1 6.3 13.7 6.9 8.5 -1.5 -0.8 -0.8 0.3<br />
Note: Regional aggregates are calculated inclusive of intra-regional trade. The calculation of export markets is based on a weighted average of import volumes in each<br />
exporting country’s market, with weights based on manufacturing trade flows in 1995.<br />
a) Export performance is calculated as the percentage change in the ratio of export volumes to export markets.<br />
b) Dynamic Asia includes Chinese Taipei; Hong Kong, China; Indonesia; Malaysia; Philippines; Singapore and Thailand.<br />
Sources: <strong>OECD</strong>; Direction of trade data - United Nations Statistical Office; <strong>OECD</strong>, Foreign Trade by Commodities.


