

OECD Economic Outlook 69 - Biblioteca Hegoa
OECD Economic Outlook 69 - Biblioteca Hegoa
OECD Economic Outlook 69 - Biblioteca Hegoa

Create successful ePaper yourself
Turn your PDF publications into a flip-book with our unique Google optimized e-Paper software.
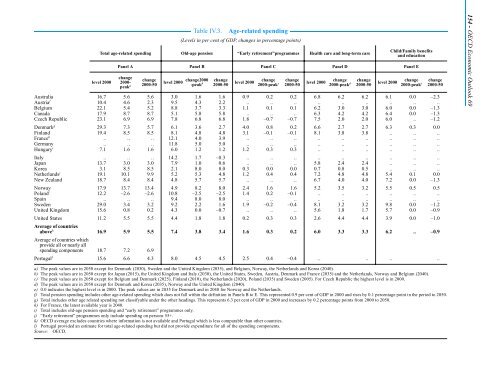
Table IV.3. Age-related spending<br />
(Levels in per cent of GDP, changes in percentage points)<br />
Total age-related spending Old-age pension “Early retirement”programmes Health care and long-term care<br />
level 2000<br />
Child/Family benefits<br />
and education<br />
Panel A Panel B Panel C Panel D Panel E<br />
change<br />
2000-<br />
peak a<br />
change<br />
2000-50<br />
level 2000 change2000<br />
-peak b<br />
change<br />
2000-50<br />
level 2000<br />
change<br />
2000-peak c<br />
change<br />
2000-50<br />
level 2000<br />
change<br />
2000-peak d<br />
change<br />
2000-50<br />
level 2000<br />
change<br />
2000-peak e<br />
Australia 16.7 5.6 5.6 3.0 1.6 1.6 0.9 0.2 0.2 6.8 6.2 6.2 6.1 0.0 –2.3<br />
Austria f 10.4 4.6 2.3 9.5 4.3 2.2 .. .. .. .. .. .. .. .. ..<br />
Belgium 22.1 5.4 5.2 8.8 3.7 3.3 1.1 0.1 0.1 6.2 3.0 3.0 6.0 0.0 –1.3<br />
Canada 17.9 8.7 8.7 5.1 5.8 5.8 .. .. .. 6.3 4.2 4.2 6.4 0.0 –1.3<br />
Czech Republic 23.1 6.9 6.9 7.8 6.8 6.8 1.8 –0.7 –0.7 7.5 2.0 2.0 6.0 .. –1.2<br />
Denmark g 29.3 7.3 5.7 6.1 3.6 2.7 4.0 0.8 0.2 6.6 2.7 2.7 6.3 0.3 0.0<br />
Finland 19.4 8.5 8.5 8.1 4.8 4.8 3.1 –0.1 –0.1 8.1 3.8 3.8 .. .. ..<br />
France h .. .. .. 12.1 4.0 3.9 .. .. .. .. .. .. .. .. ..<br />
Germany .. .. .. 11.8 5.0 5.0 .. .. .. .. .. .. .. .. ..<br />
Hungary i 7.1 1.6 1.6 6.0 1.2 1.2 1.2 0.3 0.3 .. .. .. .. .. ..<br />
Italy .. .. .. 14.2 1.7 –0.3 .. .. .. .. .. .. .. .. ..<br />
Japan 13.7 3.0 3.0 7.9 1.0 0.6 .. .. .. 5.8 2.4 2.4 .. .. ..<br />
Korea 3.1 8.5 8.5 2.1 8.0 8.0 0.3 0.0 0.0 0.7 0.8 0.5 .. .. ..<br />
Netherlandsj 19.1 10.1 9.9 5.2 5.3 4.8 1.2 0.4 0.4 7.2 4.8 4.8 5.4 0.1 0.0<br />
New Zealand 18.7 8.4 8.4 4.8 5.7 5.7 .. .. .. 6.7 4.0 4.0 7.2 0.0 –1.3<br />
Norway 17.9 13.7 13.4 4.9 8.2 8.0 2.4 1.6 1.6 5.2 3.5 3.2 5.5 0.5 0.5<br />
Polandi 12.2 –2.6 –2.6 10.8 –2.5 –2.5 1.4 0.2 –0.1 .. .. .. .. .. ..<br />
Spain .. .. .. 9.4 8.0 8.0 .. .. .. .. .. .. .. .. ..<br />
Sweden 29.0 3.4 3.2 9.2 2.2 1.6 1.9 –0.2 –0.4 8.1 3.2 3.2 9.8 0.0 –1.2<br />
United Kingdom 15.6 0.8 0.2 4.3 0.0 –0.7 .. .. .. 5.6 1.8 1.7 5.7 0.0 –0.9<br />
United States<br />
Average of countries<br />
11.2 5.5 5.5 4.4 1.8 1.8 0.2 0.3 0.3 2.6 4.4 4.4 3.9 0.0 –1.0<br />
abovek Average of countries which<br />
provide all or nearly all<br />
16.9 5.9 5.5 7.4 3.8 3.4 1.6 0.3 0.2 6.0 3.3 3.3 6.2 .. –0.9<br />
spending components 18.7 7.2 6.9<br />
Portugall 15.6 6.6 4.3 8.0 4.5 4.5 2.5 0.4 –0.4 .. .. .. ..<br />
a) The peak values are in 2050 except for Denmark (2030), Sweden and the United Kingdom (2035), and Belgium, Norway, the Netherlands and Korea (2040).<br />
b) The peak values are in 2050 except for Japan (2015), the United Kingdom and Italy (2030), the United States, Sweden, Austria, Denmark and France (2035) and the Netherlands, Norway and Belgium (2040).<br />
c) The peak values are in 2050 except for Belgium and Denmark (2025), Finland (2010), the Netherlands (2020), Poland (2035) and Sweden (2005). For Czech Republic the highest level is in 2000.<br />
d) The peak values are in 2050 except for Denmark and Korea (2035), Norway and the United Kingdom (2040).<br />
e) 0.0 indicates the highest level is in 2000. The peak values are in 2035 for Denmark and in 2040 for Norway and the Netherlands.<br />
f) Total pension spending includes other age-related spending which does not fall within the definition in Panels B to E. This represented 0.9 per cent of GDP in 2000 and rises by 0.1 percentage point in the period to 2050.<br />
g) Total includes other age related spending not classifyable under the other headings. This represents 6.3 per cent of GDP in 2000 and increases by 0.2 percentage points from 2000 to 2050.<br />
h) For France, the latest available year is 2040.<br />
i) Total includes old-age pension spending and “early retirement” programmes only.<br />
j) “Early retirement” programmes only include spending on persons 55+.<br />
k) <strong>OECD</strong> average excludes countries where information is not available and Portugal which is less comparable than other countries.<br />
l) Portugal provided an estimate for total age-related spending but did not provide expenditure for all of the spending components.<br />
Source: <strong>OECD</strong>.<br />
change<br />
2000-50<br />
154 - <strong>OECD</strong> <strong>Economic</strong> <strong>Outlook</strong> <strong>69</strong>


