

OECD Economic Outlook 69 - Biblioteca Hegoa
OECD Economic Outlook 69 - Biblioteca Hegoa
OECD Economic Outlook 69 - Biblioteca Hegoa

You also want an ePaper? Increase the reach of your titles
YUMPU automatically turns print PDFs into web optimized ePapers that Google loves.
Average<br />
1973-83<br />
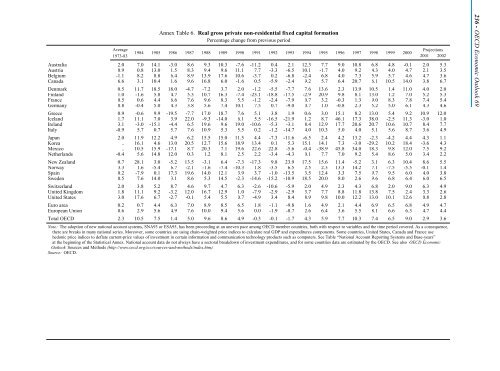
Annex Table 6. Real gross private non-residential fixed capital formation<br />
Percentage change from previous period<br />
1984 1985 1986 1987<br />
1988 1989 1990 1991<br />
1992 1993 1994 1995<br />
1996 1997 1998 1999<br />
Australia 2.0 7.0 14.1 -3.0 8.6 9.3 10.3 -7.6 -11.2 0.4 2.1 12.3 7.7 9.0 10.8 6.8 4.8 -0.1 2.0 5.3<br />
Austria 0.9 0.8 13.0 1.5 8.3 9.4 9.6 11.1 7.7 -3.3 -6.5 10.1 -1.7 4.0 9.2 4.3 4.0 4.7 2.1 3.5<br />
Belgium -1.1 8.2 8.8 6.4 8.9 13.9 17.6 10.6 -3.7 0.2 -6.8 -2.4 6.8 4.0 7.3 5.9 5.7 4.6 4.7 3.6<br />
Canada 6.6 3.1 10.4 1.6 9.6 16.8 6.0 -1.6 0.5 -5.9 -2.4 9.2 5.7 6.4 20.7 6.1 10.5 14.0 3.8 6.7<br />
Denmark 0.5 11.7 18.5 18.0 -4.7 -7.2 3.7 2.0 -1.2 -5.5 -7.7 7.6 13.6 2.3 13.9 10.5 1.4 11.0 4.0 2.0<br />
Finland 1.0 -1.6 5.8 4.7 5.3 10.7 16.3 -7.4 -23.1 -18.8 -17.5 -2.9 20.9 9.8 8.1 13.0 1.2 7.0 5.2 5.3<br />
France 0.5 0.6 4.4 6.6 7.6 9.6 8.3 5.5 -1.2 -2.4 -7.9 0.7 3.2 -0.3 1.3 9.0 8.3 7.8 7.4 5.4<br />
Germany 0.8 -0.4 5.0 4.3 3.8 5.6 7.4 10.1 7.5 0.7 -9.0 0.7 1.0 -0.8 2.3 5.2 5.0 6.1 4.3 4.6<br />
Greece 0.9 -0.6 9.9 -19.5 -7.7 17.0 18.7 7.6 5.1 3.8 1.9 0.6 3.0 15.1 8.2 13.0 5.4 9.2 10.9 12.0<br />
Iceland 1.7 11.1 7.0 3.9 22.0 -9.3 -14.0 6.1 5.5 -16.5 -21.9 1.2 8.7 46.1 17.3 38.0 -2.5 11.3 -3.0 1.0<br />
Ireland 3.1 -3.0 -15.1 -4.4 6.5 19.6 9.6 19.0 -10.6 -5.3 -3.1 8.4 12.9 17.7 20.6 20.7 10.6 10.7 8.4 7.7<br />
Italy -0.95.70.75.77.610.9 5.3 5.5 0.2 -1.2 -14.7 4.0 10.3 5.0 4.0 5.1 5.6 8.7 3.6 4.9<br />
Japan 2.0 11.9 12.2 4.9 6.2 15.5 15.0 11.5 4.4 -7.3 -11.6 -6.5 2.4 4.2 13.2 -2.3 -4.2 4.4 4.3 1.1<br />
Korea .. 16.1 4.6 13.0 20.5 12.7 15.6 18.9 13.4 0.1 5.3 15.1 14.1 7.3 -3.0 -29.2 10.2 18.4 -3.6 4.3<br />
Mexico .. 10.5 15.9 -17.1 8.7 20.3 7.1 19.6 22.6 22.8 -5.6 -0.4 -38.9 45.8 34.0 18.3 9.8 12.0 7.5 9.2<br />
Netherlands -0.45.614.8 12.0 0.3 1.2 8.1 2.5 2.2 -3.4 -4.3 0.1 7.7 7.0 9.2 5.4 8.6 5.0 3.4 2.2<br />
New Zealand 0.7 28.1 3.0 -5.2 13.5 -3.1 6.4 -7.3 -17.3 9.8 23.9 17.5 15.6 11.4 -5.2 3.1 6.3 10.4 8.6 5.5<br />
Norway 3.3 1.6 -5.4 6.7 -2.1 -1.6 -7.4 -10.3 1.8 -3.5 6.5 2.5 2.3 13.3 14.2 7.1 -7.5 -5.5 -0.1 1.4<br />
Spain 0.2 -7.9 0.1 17.3 19.6 14.0 12.1 3.9 3.7 -1.0 -13.5 3.5 12.4 3.3 7.5 9.7 9.5 6.0 4.0 3.8<br />
Sweden 0.5 7.6 14.0 3.1 8.6 5.3 14.5 -2.3 -14.6 -15.2 -10.9 18.5 20.0 8.0 2.6 9.6 6.8 6.4 6.0 6.5<br />
Switzerland 2.0 3.8 5.2 8.7 4.6 9.7 4.7 6.3 -2.6 -10.6 -5.9 2.0 4.9 2.3 4.3 6.8 2.0 9.0 6.3 4.9<br />
United Kingdom 1.8 11.1 9.2 -3.2 12.0 16.7 12.9 1.0 -7.9 -2.9 -2.9 3.7 7.7 8.8 11.8 13.8 7.5 2.4 3.3 2.6<br />
United States 3.0 17.6 6.7 -2.7 -0.1 5.4 5.5 0.7 -4.9 3.4 8.4 8.9 9.8 10.0 12.2 13.0 10.1 12.6 0.8 2.8<br />
Euro area 0.2 0.7 4.4 6.3 7.0 8.9 8.5 6.5 1.8 -1.1 -9.8 1.6 4.9 2.1 4.4 6.9 6.5 6.8 4.9 4.7<br />
European Union 0.6 2.9 5.6 4.9 7.6 10.0 9.4 5.6 0.0 -1.9 -8.7 2.6 6.4 3.6 5.5 8.1 6.6 6.3 4.7 4.4<br />
Total <strong>OECD</strong> 2.3 10.5 7.5 1.4 5.0 9.6 8.6 4.9 -0.3 -0.1 -1.7 4.3 5.9 7.7 10.3 7.4 6.5 9.0 2.9 3.6<br />
Note: The adoption of new national account systems, SNA93 or ESA95, has been proceeding at an uneven pace among <strong>OECD</strong> member countries, both with respect to variables and the time period covered. As a consequence,<br />
there are breaks in many national series. Moreover, some countries are using chain-weighted price indices to calculate real GDP and expenditures components. Some countries, United States, Canada and France use<br />
hedonic price indices to deflate current-price values of investment in certain information and communication technology products such as computers. See Table “National Account Reporting Systems and Base-years”<br />
at the beginning of the Statistical Annex. National account data do not always have a sectoral breakdown of investment expenditures, and for some countries data are estimated by the <strong>OECD</strong>. See also <strong>OECD</strong> <strong>Economic</strong><br />
<strong>Outlook</strong> Sources and Methods (http://www.oecd.org/eco/sources-and-methods/index.htm).<br />
Source: <strong>OECD</strong>.<br />
2000<br />
Projections<br />
2001 2002<br />
236 - <strong>OECD</strong> <strong>Economic</strong> <strong>Outlook</strong> <strong>69</strong>


