OECD Economic Outlook 69 - Biblioteca Hegoa
OECD Economic Outlook 69 - Biblioteca Hegoa
OECD Economic Outlook 69 - Biblioteca Hegoa
You also want an ePaper? Increase the reach of your titles
YUMPU automatically turns print PDFs into web optimized ePapers that Google loves.
160 - <strong>OECD</strong> <strong>Economic</strong> <strong>Outlook</strong> <strong>69</strong><br />
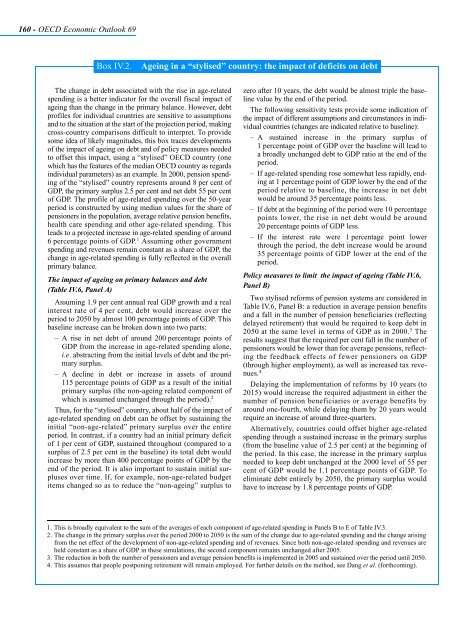
Box IV.2. Ageing in a “stylised” country: the impact of deficits on debt<br />
The change in debt associated with the rise in age-related<br />
spending is a better indicator for the overall fiscal impact of<br />
ageing than the change in the primary balance. However, debt<br />
profiles for individual countries are sensitive to assumptions<br />
and to the situation at the start of the projection period, making<br />
cross-country comparisons difficult to interpret. To provide<br />
some idea of likely magnitudes, this box traces developments<br />
of the impact of ageing on debt and of policy measures needed<br />
to offset this impact, using a “stylised” <strong>OECD</strong> country (one<br />
which has the features of the median <strong>OECD</strong> country as regards<br />
individual parameters) as an example. In 2000, pension spending<br />
of the “stylised” country represents around 8 per cent of<br />
GDP, the primary surplus 2.5 per cent and net debt 55 per cent<br />
of GDP. The profile of age-related spending over the 50-year<br />
period is constructed by using median values for the share of<br />
pensioners in the population, average relative pension benefits,<br />
health care spending and other age-related spending. This<br />
leads to a projected increase in age-related spending of around<br />
6 percentage points of GDP. 1 Assuming other government<br />
spending and revenues remain constant as a share of GDP, the<br />
change in age-related spending is fully reflected in the overall<br />
primary balance.<br />
The impact of ageing on primary balances and debt<br />
(Table IV.6, Panel A)<br />
Assuming 1.9 per cent annual real GDP growth and a real<br />
interest rate of 4 per cent, debt would increase over the<br />
period to 2050 by almost 100 percentage points of GDP. This<br />
baseline increase can be broken down into two parts:<br />
– A rise in net debt of around 200 percentage points of<br />
GDP from the increase in age-related spending alone,<br />
i.e. abstracting from the initial levels of debt and the primary<br />
surplus.<br />
– A decline in debt or increase in assets of around<br />
115 percentage points of GDP as a result of the initial<br />
primary surplus (the non-ageing related component of<br />
which is assumed unchanged through the period). 2<br />
Thus, for the “stylised” country, about half of the impact of<br />
age-related spending on debt can be offset by sustaining the<br />
initial “non-age-related” primary surplus over the entire<br />
period. In contrast, if a country had an initial primary deficit<br />
of 1 per cent of GDP, sustained throughout (compared to a<br />
surplus of 2.5 per cent in the baseline) its total debt would<br />
increase by more than 400 percentage points of GDP by the<br />
end of the period. It is also important to sustain initial surpluses<br />
over time. If, for example, non-age-related budget<br />
items changed so as to reduce the “non-ageing” surplus to<br />
zero after 10 years, the debt would be almost triple the baseline<br />
value by the end of the period.<br />
The following sensitivity tests provide some indication of<br />
the impact of different assumptions and circumstances in individual<br />
countries (changes are indicated relative to baseline):<br />
– A sustained increase in the primary surplus of<br />
1 percentage point of GDP over the baseline will lead to<br />
a broadly unchanged debt to GDP ratio at the end of the<br />
period.<br />
– If age-related spending rose somewhat less rapidly, ending<br />
at 1 percentage point of GDP lower by the end of the<br />
period relative to baseline, the increase in net debt<br />
would be around 35 percentage points less.<br />
– If debt at the beginning of the period were 10 percentage<br />
points lower, the rise in net debt would be around<br />
20 percentage points of GDP less.<br />
– If the interest rate were 1 percentage point lower<br />
through the period, the debt increase would be around<br />
35 percentage points of GDP lower at the end of the<br />
period.<br />
Policy measures to limit the impact of ageing (Table IV.6,<br />
Panel B)<br />
Two stylised reforms of pension systems are considered in<br />
Table IV.6, Panel B: a reduction in average pension benefits<br />
and a fall in the number of pension beneficiaries (reflecting<br />
delayed retirement) that would be required to keep debt in<br />
2050 at the same level in terms of GDP as in 2000. 3 The<br />
results suggest that the required per cent fall in the number of<br />
pensioners would be lower than for average pensions, reflecting<br />
the feedback effects of fewer pensioners on GDP<br />
(through higher employment), as well as increased tax revenues.<br />
4<br />
Delaying the implementation of reforms by 10 years (to<br />
2015) would increase the required adjustment in either the<br />
number of pension beneficiaries or average benefits by<br />
around one-fourth, while delaying them by 20 years would<br />
require an increase of around three-quarters.<br />
Alternatively, countries could offset higher age-related<br />
spending through a sustained increase in the primary surplus<br />
(from the baseline value of 2.5 per cent) at the beginning of<br />
the period. In this case, the increase in the primary surplus<br />
needed to keep debt unchanged at the 2000 level of 55 per<br />
cent of GDP would be 1.1 percentage points of GDP. To<br />
eliminate debt entirely by 2050, the primary surplus would<br />
have to increase by 1.8 percentage points of GDP.<br />
1. This is broadly equivalent to the sum of the averages of each component of age-related spending in Panels B to E of Table IV.3.<br />
2. The change in the primary surplus over the period 2000 to 2050 is the sum of the change due to age-related spending and the change arising<br />
from the net effect of the development of non-age-related spending and of revenues. Since both non-age-related spending and revenues are<br />
held constant as a share of GDP in these simulations, the second component remains unchanged after 2005.<br />
3. The reduction in both the number of pensioners and average pension benefits is implemented in 2005 and sustained over the period until 2050.<br />
4. This assumes that people postponing retirement will remain employed. For further details on the method, see Dang et al. (forthcoming).


