

OECD Economic Outlook 69 - Biblioteca Hegoa
OECD Economic Outlook 69 - Biblioteca Hegoa
OECD Economic Outlook 69 - Biblioteca Hegoa

You also want an ePaper? Increase the reach of your titles
YUMPU automatically turns print PDFs into web optimized ePapers that Google loves.
larger than the component related to net-entry and reallocation across existing firms,<br />
although in the trade sector entering firms seem to have a lower than average productivity<br />
growth in general, driving down aggregate growth.<br />
The decomposition of multifactor productivity<br />
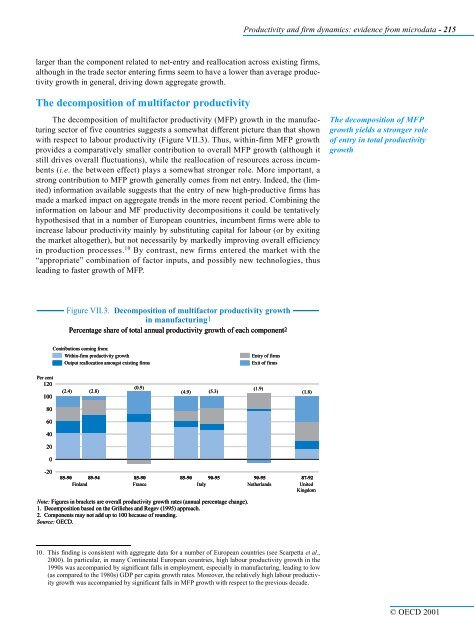
The decomposition of multifactor productivity (MFP) growth in the manufacturing<br />
sector of five countries suggests a somewhat different picture than that shown<br />
with respect to labour productivity (Figure VII.3). Thus, within-firm MFP growth<br />
provides a comparatively smaller contribution to overall MFP growth (although it<br />
still drives overall fluctuations), while the reallocation of resources across incumbents<br />
(i.e. the between effect) plays a somewhat stronger role. More important, a<br />
strong contribution to MFP growth generally comes from net entry. Indeed, the (limited)<br />
information available suggests that the entry of new high-productive firms has<br />
made a marked impact on aggregate trends in the more recent period. Combining the<br />
information on labour and MF productivity decompositions it could be tentatively<br />
hypothesised that in a number of European countries, incumbent firms were able to<br />
increase labour productivity mainly by substituting capital for labour (or by exiting<br />
the market altogether), but not necessarily by markedly improving overall efficiency<br />
in production processes. 10 By contrast, new firms entered the market with the<br />
“appropriate” combination of factor inputs, and possibly new technologies, thus<br />
leading to faster growth of MFP.<br />
Per cent<br />
120<br />
100<br />
80<br />
60<br />
40<br />
20<br />
0<br />
-20<br />
Figure VII.3. Decomposition of multifactor productivity growth<br />
in manufacturing1<br />
manufacturing1<br />
manufacturing1<br />
Percentage share of total annual productivity growth of each component2 component2 component2<br />
Contributions coming from:<br />
Within-firm productivity growth<br />
Output reallocation amongst existing firms<br />
(0.9)<br />
(2.4) (2.8) (4.9)<br />
85-90 89-94<br />
85-90 85-90<br />
90-95<br />
90-95 87-92<br />
Finland France<br />
Italy Netherlands United<br />
Kingdom<br />
10. This finding is consistent with aggregate data for a number of European countries (see Scarpetta et al.,<br />
2000). In particular, in many Continental European countries, high labour productivity growth in the<br />
1990s was accompanied by significant falls in employment, especially in manufacturing, leading to low<br />
(as compared to the 1980s) GDP per capita growth rates. Moreover, the relatively high labour productivity<br />
growth was accompanied by significant falls in MFP growth with respect to the previous decade.<br />
(5.3)<br />
Note: Figures in brackets are overall productivity growth rates (annual percentage change).<br />
1. Decomposition based on the Griliches and Regev (1995) approach.<br />
2. Components may not add up to 100 because of rounding.<br />
Source: <strong>OECD</strong>.<br />
Productivity and firm dynamics: evidence from microdata - 215<br />
Entry of firms<br />
Exit of firms<br />
(1.9)<br />
(1.8)<br />
The decomposition of MFP<br />
growth yields a stronger role<br />
of entry in total productivity<br />
growth<br />
© <strong>OECD</strong> 2001


