

OECD Economic Outlook 69 - Biblioteca Hegoa
OECD Economic Outlook 69 - Biblioteca Hegoa
OECD Economic Outlook 69 - Biblioteca Hegoa

You also want an ePaper? Increase the reach of your titles
YUMPU automatically turns print PDFs into web optimized ePapers that Google loves.
© <strong>OECD</strong> 2001<br />
Average<br />
1973-83<br />
1984 1985 1986 1987<br />
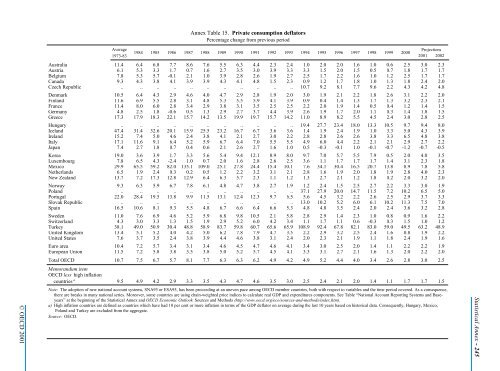
Annex Table 15. Private consumption deflators<br />
Percentage change from previous period<br />
1988 1989 1990 1991<br />
1992 1993 1994 1995<br />
1996 1997 1998 1999<br />
Australia 11.4 6.4 6.8 7.7 8.6 7.6 5.5 6.3 4.4 2.3 2.4 1.0 2.0 2.0 1.6 1.0 0.6 2.5 3.0 2.3<br />
Austria 6.1 5.3 3.3 1.7 0.7 1.6 2.7 3.5 3.0 3.9 3.3 3.3 1.5 2.0 1.5 0.5 0.7 1.8 1.7 1.7<br />
Belgium 7.8 5.3 5.7 -0.1 2.1 1.0 3.9 2.8 2.6 1.9 2.7 2.5 1.7 2.2 1.6 1.0 1.2 2.5 1.7 1.7<br />
Canada 9.3 4.3 3.8 4.1 3.9 3.9 4.3 4.1 4.8 1.5 2.3 0.9 1.2 1.7 1.8 1.0 1.3 1.8 2.4 2.0<br />
Czech Republic .. .. .. .. .. .. .. .. .. .. .. 10.7 9.2 8.1 7.7 9.6 2.2 4.3 4.2 4.8<br />
Denmark 10.5 6.4 4.3 2.9 4.6 4.0 4.7 2.9 2.8 1.9 2.0 3.0 1.9 2.1 2.2 1.8 2.6 3.1 2.2 2.0<br />
Finland 11.6 6.9 5.5 2.8 3.1 4.8 5.3 5.5 5.9 4.1 3.9 0.9 0.4 1.4 1.3 1.7 1.3 3.2 2.3 2.1<br />
France 11.4 8.0 6.0 2.8 3.4 2.9 3.8 3.1 3.5 2.5 2.5 2.2 2.0 1.9 1.4 0.5 0.4 1.2 1.4 1.5<br />
Germany 4.8 2.5 1.8 -0.6 0.5 1.3 2.9 2.7 3.7 4.4 3.9 2.6 1.9 1.7 2.0 1.1 0.3 1.4 1.8 1.5<br />
Greece 17.3 17.9 18.3 22.1 15.7 14.2 13.5 19.9 19.7 15.7 14.2 11.0 8.9 8.2 5.5 4.5 2.4 3.0 2.8 2.5<br />
Hungary .. .. .. .. .. .. .. .. .. .. .. 19.4 27.7 23.4 18.0 13.3 10.5 9.7 9.4 8.0<br />
Iceland 47.4 31.4 32.6 20.1 15.9 25.5 23.2 16.7 6.7 3.6 3.6 1.4 1.9 2.4 1.9 1.0 3.3 5.0 4.3 3.9<br />
Ireland 15.2 7.4 5.0 4.6 2.4 3.8 4.1 2.1 2.7 3.0 2.2 2.8 2.8 2.6 2.6 3.8 3.3 6.5 4.8 3.8<br />
Italy 17.1 11.6 9.1 6.4 5.2 5.9 6.7 6.4 7.0 5.5 5.5 4.9 6.0 4.4 2.2 2.1 2.1 2.9 2.7 2.2<br />
Japan 7.4 2.7 1.8 0.7 0.4 0.6 2.1 2.6 2.7 1.6 1.0 0.5 -0.3 -0.1 1.0 -0.1 -0.7 -1.2 -0.7 -0.5<br />
Korea 19.0 3.6 3.9 1.7 3.3 5.6 5.4 9.4 12.1 8.9 8.0 9.7 7.0 5.7 5.5 7.9 0.5 2.0 4.0 3.5<br />
Luxembourg 7.8 6.5 4.3 -2.4 1.0 0.7 2.0 1.6 2.8 2.6 2.5 3.6 1.1 1.7 1.7 1.7 1.4 3.1 2.3 1.8<br />
Mexico 29.9 65.5 59.2 82.0 135.1 109.0 25.1 27.8 24.4 15.4 10.1 7.6 34.1 30.4 16.5 20.7 13.8 8.9 7.8 5.8<br />
Netherlands 6.5 1.9 2.4 0.3 0.2 0.5 1.2 2.2 3.2 3.1 2.1 2.8 1.6 1.9 2.0 1.8 1.9 2.8 4.0 2.3<br />
New Zealand 13.7 7.2 17.3 12.8 12.9 6.4 6.3 5.7 2.3 1.1 1.2 1.3 2.7 2.1 1.2 1.8 0.2 2.0 3.2 2.0<br />
Norway 9.3 6.3 5.9 6.7 7.8 6.1 4.8 4.7 3.8 2.7 1.9 1.2 2.4 1.5 2.5 2.7 2.2 3.3 3.0 1.9<br />
Poland .. .. .. .. .. .. .. .. .. .. .. 37.1 27.9 20.0 14.7 11.5 7.2 10.2 6.5 5.0<br />
Portugal 22.0 28.4 19.5 13.8 9.9 11.5 13.1 12.4 12.3 9.7 6.5 5.6 4.5 3.2 2.2 2.6 2.5 2.9 3.7 3.3<br />
Slovak Republic .. .. .. .. .. .. .. .. .. .. .. 13.0 10.2 5.2 6.0 6.1 10.2 11.3 7.5 7.0<br />
Spain 16.5 10.6 8.1 9.3 5.5 4.8 6.7 6.6 6.4 6.6 5.3 4.8 4.8 3.5 2.4 2.0 2.4 3.6 3.2 2.8<br />
Sweden 11.0 7.6 6.9 4.6 5.2 5.9 6.8 9.8 10.5 2.1 5.8 2.8 2.9 1.4 2.3 1.0 0.8 0.9 1.6 2.2<br />
Switzerland 4.3 3.0 3.3 1.3 1.5 1.9 2.9 5.2 6.0 4.2 3.4 1.1 1.7 1.1 0.6 -0.3 0.3 1.5 1.0 1.2<br />
Turkey 38.1 49.0 50.9 30.4 48.8 58.9 83.7 59.8 60.7 65.6 65.9 108.9 92.4 67.8 82.1 83.0 59.0 49.5 63.2 48.9<br />
United Kingdom 13.4 5.1 5.2 4.0 4.2 5.0 6.2 7.8 7.9 4.7 3.5 2.2 2.9 3.2 2.5 2.4 1.6 0.8 1.9 2.2<br />
United States 7.6 3.7 3.5 2.4 3.8 3.9 4.4 4.6 3.8 3.1 2.4 2.0 2.3 2.1 1.9 1.1 1.8 2.4 1.9 1.6<br />
Euro area 10.4 7.2 5.7 3.4 3.1 3.4 4.6 4.5 4.7 4.6 4.1 3.4 3.0 2.5 2.0 1.4 1.1 2.2 2.2 1.9<br />
European Union 11.5 7.2 5.8 3.8 3.5 3.8 5.0 5.2 5.7 4.5 4.1 3.3 3.1 2.7 2.1 1.6 1.3 2.0 2.2 2.0<br />
Total <strong>OECD</strong><br />
Memorandum item<br />
<strong>OECD</strong> less high inflation<br />
10.7 7.5 6.7 5.7 8.1 7.7 6.3 6.3 6.2 4.9 4.2 4.9 5.2 4.4 4.0 3.4 2.6 2.8 3.0 2.5<br />
a<br />
countries 9.5 4.9 4.2 2.9 3.3 3.5 4.3 4.7 4.6 3.5 3.0 2.5 2.4 2.1 2.0 1.4 1.1 1.7 1.7 1.5<br />
Note: The adoption of new national account systems, SNA93 or ESA95, has been proceeding at an uneven pace among <strong>OECD</strong> member countries, both with respect to variables and the time period covered. As a consequence,<br />
there are breaks in many national series. Moreover, some countries are using chain-weighted price indices to calculate real GDP and expenditures components. See Table “National Account Reporting Systems and Baseyears”<br />
at the beginning of the Statistical Annex and <strong>OECD</strong> <strong>Economic</strong> <strong>Outlook</strong> Sources and Methods (http://www.oecd.org/eco/sources-and-methods/index.htm).<br />
a) High inflation countries are defined as countries which have had 10 per cent or more inflation in terms of the GDP deflator on average during the last 10 years based on historical data. Consequently, Hungary, Mexico,<br />
Poland and Turkey are excluded from the aggregate.<br />
Source: <strong>OECD</strong>.<br />
2000<br />
Projections<br />
2001 2002<br />
Statistical Annex - 245


