

OECD Economic Outlook 69 - Biblioteca Hegoa
OECD Economic Outlook 69 - Biblioteca Hegoa
OECD Economic Outlook 69 - Biblioteca Hegoa

Create successful ePaper yourself
Turn your PDF publications into a flip-book with our unique Google optimized e-Paper software.
© <strong>OECD</strong> 2001<br />
Average<br />
1973-83<br />
1984 1985 1986 1987<br />
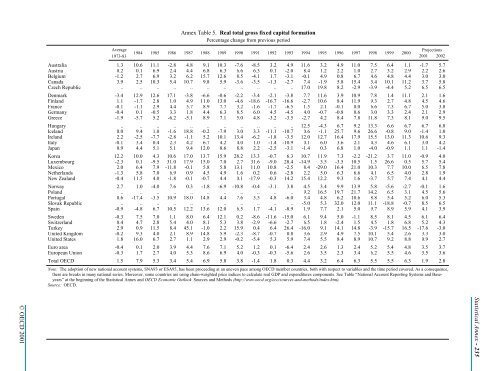
Annex Table 5. Real total gross fixed capital formation<br />
Percentage change from previous period<br />
1988 1989 1990 1991<br />
1992 1993 1994 1995<br />
1996 1997 1998 1999<br />
Australia 1.3 10.6 11.1 -2.8 4.8 9.1 10.3 -7.6 -8.5 3.2 4.9 11.6 3.2 4.9 11.0 7.5 6.4 1.1 -1.7 5.7<br />
Austria 0.2 0.1 6.9 2.4 4.4 6.8 6.3 6.6 6.3 0.1 -2.0 8.4 1.2 2.2 1.0 2.7 3.2 2.9 2.2 2.6<br />
Belgium -1.2 2.7 6.9 3.2 6.2 15.7 12.6 8.5 -4.1 1.7 -3.1 -0.1 4.9 0.8 6.7 4.6 4.8 4.4 3.0 3.0<br />
Canada 3.9 2.5 10.3 5.4 10.7 9.8 5.9 -3.6 -3.5 -1.3 -2.7 7.4 -1.9 5.8 15.4 3.4 10.1 11.2 3.7 5.8<br />
Czech Republic .. .. .. .. .. .. .. .. .. .. .. 17.0 19.8 8.2 -2.9 -3.9 -4.4 5.2 6.5 6.5<br />
Denmark -3.4 12.9 12.6 17.1 -3.8 -6.6 -0.6 -2.2 -3.4 -2.1 -3.8 7.7 11.6 3.9 10.9 7.8 1.4 11.1 2.1 1.6<br />
Finland 1.1 -1.7 2.8 1.0 4.9 11.0 13.0 -4.6 -18.6 -16.7 -16.6 -2.7 10.6 8.4 11.9 9.3 2.7 4.8 4.5 4.6<br />
France -0.1 -1.1 2.9 4.4 5.7 8.9 7.7 3.2 -1.6 -1.7 -6.5 1.5 2.1 -0.1 0.0 6.6 7.3 6.7 5.0 3.8<br />
Germany -0.4 0.1 -0.5 3.3 1.8 4.4 6.3 8.5 6.0 4.5 -4.5 4.0 -0.7 -0.8 0.6 3.0 3.3 2.4 2.1 2.9<br />
Greece -1.9 -5.7 5.2 -6.2 -5.1 8.9 7.1 5.0 4.8 -3.2 -3.5 -2.7 4.2 8.4 7.8 11.8 7.3 8.1 9.0 9.5<br />
Hungary .. .. .. .. .. .. .. .. .. .. .. 12.5 -4.3 6.7 9.2 13.3 6.6 6.7 6.7 6.8<br />
Iceland 0.0 9.4 1.0 -1.6 18.8 -0.2 -7.9 3.0 3.3 -11.1 -10.7 0.6 -1.1 25.7 9.6 26.6 -0.8 9.0 -1.4 1.0<br />
Ireland 2.2 -2.5 -7.7 -2.8 -1.1 5.2 10.1 13.4 -6.2 -1.8 -3.5 12.0 12.7 16.4 17.9 15.5 13.0 11.3 10.6 9.3<br />
Italy -0.13.40.42.34.26.7 4.2 4.0 1.0 -1.4 -10.9 0.1 6.0 3.6 2.1 4.3 4.6 6.1 3.0 4.2<br />
Japan 0.9 4.4 5.1 5.1 9.4 12.0 8.6 8.8 2.2 -2.5 -3.1 -1.4 0.3 6.8 1.0 -4.0 -0.9 1.1 1.1 -1.4<br />
Korea 12.2 10.0 4.3 10.6 17.0 13.7 15.9 28.2 13.3 -0.7 6.3 10.7 11.9 7.3 -2.2 -21.2 3.7 11.0 -0.9 4.0<br />
Luxembourg -2.3 0.1 -9.5 31.0 17.9 15.0 7.0 2.7 31.6 -9.0 28.4 -14.9 3.5 -3.5 10.5 1.5 26.6 0.5 5.7 5.4<br />
Mexico 2.0 6.4 7.9 -11.8 -0.1 5.8 5.8 13.1 11.0 10.8 -2.5 8.4 -29.0 16.4 21.0 10.3 7.7 10.0 6.5 7.8<br />
Netherlands -1.35.87.06.9 0.9 4.5 4.9 1.6 0.2 0.6 -2.8 2.2 5.0 6.3 6.6 4.1 6.5 4.0 2.8 1.9<br />
New Zealand -0.4 11.5 4.0 -1.8 -0.1 -0.7 4.4 0.1 -17.9 -0.3 14.2 15.4 12.2 9.3 1.6 -3.7 5.7 7.4 4.1 4.4<br />
Norway 2.7 1.0 -4.0 7.6 0.3 -1.8 -6.9 -10.8 -0.4 -3.1 3.8 4.5 3.4 9.9 13.9 5.8 -5.6 -2.7 -0.1 1.6<br />
Poland .. .. .. .. .. .. .. .. .. .. .. 9.2 16.5 19.7 21.7 14.2 6.5 3.1 4.5 5.6<br />
Portugal 0.6 -17.4 -3.5 10.9 18.0 14.8 4.4 7.6 3.5 4.8 -6.0 3.4 4.8 6.2 10.6 8.8 5.4 5.2 6.0 5.3<br />
Slovak Republic .. .. .. .. .. .. .. .. .. .. .. -5.05.3 32.0 12.0 11.1 -18.8 -0.7 8.5 6.5<br />
Spain -0.9-4.86.710.5 12.2 13.6 12.0 6.5 1.7 -4.1 -8.9 1.9 7.7 2.1 5.0 9.7 8.9 5.9 4.1 3.9<br />
Sweden -0.3 7.5 7.0 1.1 8.0 6.4 12.1 0.2 -8.6 -11.6 -15.0 6.1 9.4 5.0 -1.1 8.5 8.1 4.5 6.1 6.4<br />
Switzerland 0.4 4.7 2.8 5.4 4.0 8.1 5.3 3.8 -2.9 -6.6 -2.7 6.5 1.8 -2.4 1.5 4.5 1.8 6.8 5.2 4.3<br />
Turkey 2.9 0.9 11.5 8.4 45.1 -1.0 2.2 15.9 0.4 6.4 26.4 -16.0 9.1 14.1 14.8 -3.9 -15.7 16.5 -17.6 -3.0<br />
United Kingdom -0.2 9.3 4.0 2.1 8.9 14.8 5.9 -2.3 -8.7 -0.7 0.8 3.6 2.9 4.9 7.5 10.1 5.4 2.6 3.3 3.0<br />
United States 1.8 16.0 6.7 2.7 1.1 2.9 2.9 -0.2 -5.4 5.3 5.9 7.4 5.5 8.4 8.9 10.7 9.2 8.8 0.9 2.7<br />
Euro area -0.4 0.1 2.0 3.9 4.4 7.6 7.1 5.2 1.2 0.1 -6.4 2.4 2.6 1.3 2.4 5.2 5.4 4.8 3.5 3.7<br />
European Union -0.3 1.7 2.7 4.0 5.3 8.6 6.9 4.0 -0.3 -0.3 -5.6 2.6 3.5 2.3 3.4 6.2 5.5 4.6 3.5 3.6<br />
Total <strong>OECD</strong> 1.5 7.9 5.3 3.4 5.4 6.9 5.8 3.8 -1.4 1.8 0.3 4.4 3.2 6.4 6.3 5.5 5.5 6.3 1.9 2.8<br />
Note: The adoption of new national account systems, SNA93 or ESA95, has been proceeding at an uneven pace among <strong>OECD</strong> member countries, both with respect to variables and the time period covered. As a consequence,<br />
there are breaks in many national series. Moreover, some countries are using chain-weighted price indices to calculate real GDP and expenditures components. See Table “National Account Reporting Systems and Baseyears”<br />
at the beginning of the Statistical Annex and <strong>OECD</strong> <strong>Economic</strong> <strong>Outlook</strong> Sources and Methods (http://www.oecd.org/eco/sources-and-methods/index.htm).<br />
Source: <strong>OECD</strong>.<br />
2000<br />
Projections<br />
2001 2002<br />
Statistical Annex - 235


