- Page 1 and 2:
OECD Economic Outlook ECONOMICS «
- Page 3 and 4:
OECD ECONOMIC OUTLOOK 69 JUNE 2001
- Page 5 and 6:
FOREWORD This edition of the OECD E
- Page 7 and 8:
TABLE OF CONTENTS Editorial .......
- Page 9 and 10:
Table of contents - vii I.5. Profit
- Page 11 and 12:
EDITORIAL Economic growth in the OE
- Page 13 and 14:
ingness to liquidate insolvent bank
- Page 15 and 16:
2 - OECD Economic Outlook 69 Weakne
- Page 17 and 18:
4 - OECD Economic Outlook 69 Easier
- Page 19 and 20:
6 - OECD Economic Outlook 69 Box I.
- Page 21 and 22:
8 - OECD Economic Outlook 69 ... wh
- Page 23 and 24:
10 - OECD Economic Outlook 69 Curre
- Page 25 and 26:
12 - OECD Economic Outlook 69 Decem
- Page 27 and 28:
14 - OECD Economic Outlook 69 The s
- Page 29 and 30:
16 - OECD Economic Outlook 69 Per c
- Page 31 and 32:
18 - OECD Economic Outlook 69 Per c
- Page 33 and 34:
20 - OECD Economic Outlook 69 … b
- Page 35 and 36:
22 - OECD Economic Outlook 69 Per c
- Page 37 and 38:
24 - OECD Economic Outlook 69 Falli
- Page 39 and 40:
26 - OECD Economic Outlook 69 Unite
- Page 41 and 42:
28 - OECD Economic Outlook 69 Monet
- Page 43 and 44:
30 - OECD Economic Outlook 69 Box I
- Page 45 and 46:
32 - OECD Economic Outlook 69 Per c
- Page 47 and 48:
34 - OECD Economic Outlook 69 The f
- Page 49 and 50:
36 - OECD Economic Outlook 69 Monet
- Page 51 and 52:
38 - OECD Economic Outlook 69 More
- Page 53 and 54:
40 - OECD Economic Outlook 69 ... w
- Page 55 and 56:
42 - OECD Economic Outlook 69 … w
- Page 57 and 58:
44 - OECD Economic Outlook 69 Per c
- Page 59 and 60:
II. DEVELOPMENTS IN INDIVIDUAL OECD
- Page 61 and 62:
1998 1999 2000 2001 2002 Household
- Page 63 and 64:
the long-run tax cut will be introd
- Page 65 and 66:
Japan: Employment, income and infla
- Page 67 and 68:
Japan: External indicators 1998 199
- Page 69 and 70:
Germany Developments in individual
- Page 71 and 72:
1998 1999 2000 2001 2002 Household
- Page 73 and 74:
France Developments in individual O
- Page 75 and 76:
1998 1999 2000 2001 2002 Household
- Page 77 and 78:
Italy Developments in individual OE
- Page 79 and 80:
1998 1999 2000 2001 2002 Household
- Page 81 and 82:
United Kingdom Developments in indi
- Page 83 and 84:
1998 1999 2000 2001 2002 Household
- Page 85 and 86:
Canada Developments in individual O
- Page 87 and 88:
1998 1999 2000 2001 2002 Household
- Page 89 and 90:
86 Australia Developments in indivi
- Page 91 and 92:
cially after the RBA’s recent int
- Page 93 and 94:
Austria: Demand, output and prices
- Page 95 and 96:
Belgium Developments in individual
- Page 97 and 98:
contribution of net exports to grow
- Page 99 and 100:
Czech Republic: Demand, output and
- Page 101 and 102:
Denmark Developments in individual
- Page 103 and 104:
hold incomes recover. Although expo
- Page 105 and 106:
Finland: Demand, output and prices
- Page 107 and 108:
Greece: Demand, output and prices 1
- Page 109 and 110:
Hungary: Demand, output and prices
- Page 111 and 112:
Iceland: Demand, output and prices
- Page 113 and 114:
Ireland: Demand, output and prices
- Page 115 and 116:
Korea Developments in individual OE
- Page 117 and 118:
Luxembourg Developments in individu
- Page 119 and 120:
Mexico Developments in individual O
- Page 121 and 122:
Netherlands Developments in individ
- Page 123 and 124:
age this year, mainly reflecting ta
- Page 125 and 126:
New Zealand: Demand, output and pri
- Page 127 and 128:
Norway Developments in individual O
- Page 129 and 130:
There are substantial risks to the
- Page 131 and 132:
Poland: Demand, output and prices 1
- Page 133 and 134: Portugal Developments in individual
- Page 135 and 136: especially as the deficit has been
- Page 137 and 138: Slovak Republic: Demand, output and
- Page 139 and 140: Spain: Demand, output and prices 19
- Page 141 and 142: Sweden Developments in individual O
- Page 143 and 144: Despite recent indicators suggestin
- Page 145 and 146: Switzerland: Demand, output and pri
- Page 147 and 148: Turkey: Demand, output and prices 1
- Page 149 and 150: III. DEVELOPMENTS IN SELECTED NON-M
- Page 151 and 152: Substantial progress has been made
- Page 153 and 154: with a 7 per cent increase in urban
- Page 155 and 156: the current account should remain q
- Page 157 and 158: IV. FISCAL IMPLICATIONS OF AGEING:
- Page 159 and 160: Third, in any case, projections ove
- Page 161 and 162: The baseline projections for public
- Page 163 and 164: Old-age pension spending Levels of
- Page 165 and 166: Old-age pension spending trends to
- Page 167 and 168: Fiscal implications of ageing: proj
- Page 169 and 170: ment is to be maintained for all. F
- Page 171 and 172: Table IV.5. Changes in spending, re
- Page 173 and 174: The projected deterioration in the
- Page 175 and 176: Fiscal implications of ageing: proj
- Page 177 and 178: period (Table IV.6, Panel B). This
- Page 179 and 180: BIBLIOGRAPHY Fiscal implications of
- Page 181 and 182: 170 - OECD Economic Outlook 69 Tax
- Page 183: 172 - OECD Economic Outlook 69 Tabl
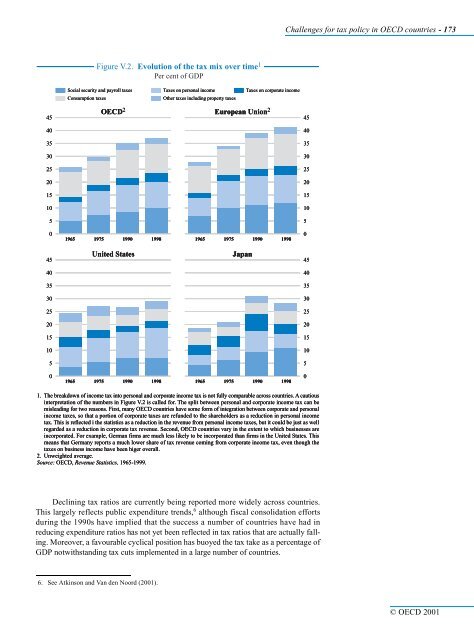
- Page 187 and 188: 176 - OECD Economic Outlook 69 …
- Page 189 and 190: 178 - OECD Economic Outlook 69 …
- Page 191 and 192: 180 - OECD Economic Outlook 69 Prog
- Page 193 and 194: 182 - OECD Economic Outlook 69 Ther
- Page 195 and 196: 184 - OECD Economic Outlook 69 coun
- Page 197 and 198: VI. ENCOURAGING ENVIRONMENTALLY SUS
- Page 199 and 200: Tax base Table VI.1. Use of economi
- Page 201 and 202: A complication with permit trading
- Page 203 and 204: A double dividend? In practice, new
- Page 205 and 206: Environmental policies that are eff
- Page 207 and 208: eing hit with the full tax. This av
- Page 209 and 210: US$/cubic metre 3.5 3.0 2.5 2.0 1.5
- Page 211 and 212: the economic effects of environment
- Page 213 and 214: Cost-benefit analysis Encouraging e
- Page 215 and 216: may play an important role in the a
- Page 217 and 218: BIBLIOGRAPHY Encouraging environmen
- Page 219 and 220: 210 - OECD Economic Outlook 69 …
- Page 221 and 222: 212 - OECD Economic Outlook 69 Prod
- Page 223 and 224: 214 - OECD Economic Outlook 69 The
- Page 225 and 226: 216 - OECD Economic Outlook 69 Many
- Page 227 and 228: 218 - OECD Economic Outlook 69 Entr
- Page 229 and 230: 220 - OECD Economic Outlook 69 Box
- Page 231 and 232: 222 - OECD Economic Outlook 69 BIBL
- Page 233 and 234: 224 - OECD Economic Outlook 69 List
- Page 235 and 236:
226 - OECD Economic Outlook 69 Coun
- Page 237 and 238:
Annex Tables Statistical Annex - 22
- Page 239 and 240:
© OECD 2001 Average 1973-83 1984 1
- Page 241 and 242:
© OECD 2001 Average 1973-83 1984 1
- Page 243 and 244:
© OECD 2001 Average 1973-83 1984 1
- Page 245 and 246:
© OECD 2001 Average 1973-83 1984 1
- Page 247 and 248:
© OECD 2001 Average 1973-83 1984 1
- Page 249 and 250:
© OECD 2001 Annex Table 11. Output
- Page 251 and 252:
© OECD 2001 Annex Table 13. Unit l
- Page 253 and 254:
© OECD 2001 Average 1973-83 1984 1
- Page 255 and 256:
© OECD 2001 Annex Table 17. Oil an
- Page 257 and 258:
© OECD 2001 Average 1973-83 Annex
- Page 259 and 260:
© OECD 2001 Annex Table 21. Unempl
- Page 261 and 262:
© OECD 2001 Annex Table 23. Labour
- Page 263 and 264:
© OECD 2001 Annex Table 27. Gross
- Page 265 and 266:
© OECD 2001 Annex Table 29 . Gener
- Page 267 and 268:
© OECD 2001 Annex Table 31. Genera
- Page 269 and 270:
© OECD 2001 Annex Table 33. Genera
- Page 271 and 272:
© OECD 2001 Annex Table 35. Genera
- Page 273 and 274:
© OECD 2001 1983 1984 1985 1986 An
- Page 275 and 276:
© OECD 2001 Annex Table 39. Effect
- Page 277 and 278:
© OECD 2001 Annex Table 41. Import
- Page 279 and 280:
© OECD 2001 Annex Table 43. Import
- Page 281 and 282:
© OECD 2001 1983 1984 1985 1986 An
- Page 283 and 284:
© OECD 2001 Annex Table 47. Shares
- Page 285 and 286:
© OECD 2001 Annex Table 49. Non-fa
- Page 287 and 288:
© OECD 2001 Annex Table 51. Curren
- Page 289 and 290:
© OECD 2001 Annex Table 53. Struct
- Page 291 and 292:
Annex Table 54. (cont'd) Semiannual
- Page 293 and 294:
Annex Table 56. Contributions to ch
- Page 295 and 296:
Annex Table 57. Household wealth an
- Page 297 and 298:
Annex Table 61. Monetary and credit
- Page 299 and 300:
Annex Table 63. Geographical struct
- Page 301 and 302:
OTHER OECD STATISTICAL SERIES ON DI
- Page 303 and 304:
For customers in Austria, Germany a


