- Page 1 and 2:
AN EPIDEMIOLOGICAL STUDY OF LISTERI
- Page 3 and 4:
In the second part of the study a l
- Page 5 and 6:
I would like to thank to Metin Oztu
- Page 7 and 8:
DECLARATION I declare that apart fr
- Page 9 and 10:
2. 2. Materials and Methods 47 2. 2
- Page 11 and 12:
4. 4. Discussion 125 CHAPTER 5 A pi
- Page 13 and 14:
CHAPTER 1 LIST OF TABLES AND FIGURE
- Page 15 and 16:
Table 3. 11. The relationship betwe
- Page 17 and 18:
CHAPTER 5 Table 5. 1. Date of visit
- Page 19 and 20:
Figure 6. 4. The monthly faecal exc
- Page 21 and 22:
Listeralla hepatolytica. In the sam
- Page 23 and 24:
Listeriolysin O (Fernandaz-Garayzab
- Page 25 and 26:
L. monocytogenes was the only recog
- Page 27 and 28:
Table 1. 2. Serovar distribution of
- Page 29 and 30:
Serotyping is based on the identifi
- Page 31 and 32:
electrophoresis. Different strains
- Page 33 and 34:
and others (1995) came to the concl
- Page 35 and 36:
animals suggests that L. monocytoge
- Page 37 and 38:
Immunity reducing Septicaemia facto
- Page 39 and 40:
monocytogenes and a prerequisite to
- Page 41 and 42:
a variable number of cases of encep
- Page 43 and 44:
The relationship between age and Li
- Page 45 and 46:
a reservoir from which it spreads t
- Page 47 and 48:
1. 8. Clinical signs and pathology
- Page 49 and 50:
is seldom clinical illness in the d
- Page 51 and 52:
Bacterial culture is widely used fo
- Page 53 and 54:
Differential diagnosis: Listerial m
- Page 55 and 56:
Since elimination of L. monocytogen
- Page 57 and 58:
first description, it was only 1980
- Page 59 and 60:
and meat products have resulted in
- Page 61 and 62:
infectious dose for the infection i
- Page 63 and 64:
a longitudinal study involving five
- Page 65 and 66:
in Britain. In this part of the stu
- Page 67 and 68:
groups were excluded from analysis.
- Page 69 and 70:
The proportions of farms with cases
- Page 71 and 72:
Table 2. 3. The proportion of anima
- Page 73 and 74:
percentage 50 45 40 35 30 25 20 15
- Page 75 and 76:
Milking cows (%) Rep. heifers (%) D
- Page 77 and 78:
Abortion 274 (57.8%) 28 (21.9%) Ner
- Page 79 and 80:
with others (Kanuk and Berenson 197
- Page 81 and 82:
occurred in replacement heifers and
- Page 83 and 84:
CHAPTER 3 The relationship between
- Page 85 and 86:
(ii) Cases in milking cows: Farms r
- Page 87 and 88:
To assess the relationship between
- Page 89 and 90:
) Duration of housing: If animals w
- Page 91 and 92:
d) Presence of moles: Farmers were
- Page 93 and 94:
listeriosis. Maize silage feeding a
- Page 95 and 96:
found between the duration of feedi
- Page 97 and 98:
a) Type of housing : Housing animal
- Page 99 and 100:
Herd sizes n Y N OR P value x Y N O
- Page 101 and 102:
of disease. Similarly storing feed
- Page 103 and 104:
a) Type of forages: Feeding maize s
- Page 105 and 106:
) Use of bedding: Using straw beddi
- Page 107 and 108:
) Source of forages: Home made gras
- Page 109 and 110:
1.29-18.22) whereas straw bedding i
- Page 111 and 112:
100 2 34 2.33 0.01 X 2 22 3.35 0.01
- Page 113 and 114:
a) Dung disposal: Storage of manure
- Page 115 and 116:
vaccination against Leptospirosis +
- Page 117 and 118: suppression of the growth of Lister
- Page 119 and 120: 1989, Sargison 1993). It is also po
- Page 121 and 122: L. monocytogenes has been isolated
- Page 123 and 124: association (Kirkwood 1988, Thrusfi
- Page 125 and 126: The predictor variables that met ou
- Page 127 and 128: Forage feeding Maize silage Hay Str
- Page 129 and 130: indoor feeding fed ad libitum on th
- Page 131 and 132: cases of Listeriosis in sheep 2.9 1
- Page 133 and 134: and controlling moles in fields wer
- Page 135 and 136: Cases of Listeriosis in beef cattle
- Page 137 and 138: This model was similar to the Model
- Page 139 and 140: Table 4. 9. The multivariate relati
- Page 141 and 142: 5) Nervous signs: Cases of Listerio
- Page 143 and 144: feeders, maize silage feeding in ri
- Page 145 and 146: A contradictory finding was made ab
- Page 147 and 148: selective enrichment broth, at refr
- Page 149 and 150: growth of some strains of Listeria
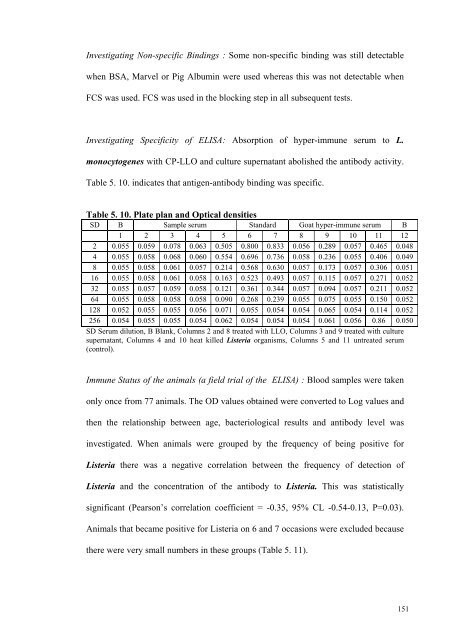
- Page 151 and 152: 5. 2. 2. Bacteriology : a) Culture
- Page 153 and 154: culturing negative LSEB (1/10w/v) s
- Page 155 and 156: 6) Sugar tests: Listeria are capabl
- Page 157 and 158: uffered saline (PBS), pH 7.2, centr
- Page 159 and 160: Investigation of non-specific bindi
- Page 161 and 162: and 0.94 for L. monocytogenes (17/1
- Page 163 and 164: Detection limit of the method: A si
- Page 165 and 166: Relationship between housing, silag
- Page 167: 5 13 3 3 1 3 1 1 1 6 14 1 4 5 3 1 0
- Page 171 and 172: frequency of isolation of L. monocy
- Page 173 and 174: CHAPTER 6 A study of the dynamic of
- Page 175 and 176: There were no sample size calculati
- Page 177 and 178: 4 of the farms had their silage ana
- Page 179 and 180: a) Faecal samples: Faecal samples w
- Page 181 and 182: • • • 1 5 9 6. 2. 5. Sample p
- Page 183 and 184: A total of 944 isolates of L. monoc
- Page 185 and 186: UK), 0.5μM DNA primer, 1 unit Supe
- Page 187 and 188: entered and left the herd over the
- Page 189 and 190: Table 6. 7. Monthly frequency of ex
- Page 191 and 192: Table 6. 8. The relationship betwee
- Page 193 and 194: (MA) mean age, (n) number, (R) rang
- Page 195 and 196: frequency of excretion (P
- Page 197 and 198: There was no evidence from this far
- Page 199 and 200: ) Environmental samples: Both L. in
- Page 201 and 202: monocytogenes. By April the proport
- Page 203 and 204: A total of 211 milking cows were ex
- Page 205 and 206: 100 % 90 80 70 60 50 40 30 20 10 0
- Page 207 and 208: The number of new cases each month
- Page 209 and 210: monocytogenes was also isolated fro
- Page 211 and 212: Table 6. 18 The isolates, their ori
- Page 213 and 214: Table 6. 19. The distribution of th
- Page 215 and 216: On farm C pattern 1 was detected in
- Page 217 and 218: Figure 6. 8. The repeatability of R
- Page 219 and 220:
Figure 6. 10. The distribution of s
- Page 221 and 222:
Figure 6. 12a. The RAPD pattern obt
- Page 223 and 224:
1988, Husu 1990) and from zero to a
- Page 225 and 226:
experimentally been shown that ther
- Page 227 and 228:
periods. However, on farms B and E
- Page 229 and 230:
A large number of L. monocytogenes
- Page 231 and 232:
Figure 6. 13. Animal-environment cy
- Page 233 and 234:
Some important farming practices we
- Page 235 and 236:
chance finding of L. monocytogenes
- Page 237 and 238:
Asahi, O., Hosoda, T. and Akuyama,
- Page 239 and 240:
Bourry, A. and Poutrel, B. (1996) B
- Page 241 and 242:
Chakraborty, T., Ebel, F., Wehland,
- Page 243 and 244:
delGarso, L. and Wallop, W. (1975)
- Page 245 and 246:
Eveland, W.C. (1963) Demonstration
- Page 247 and 248:
Fraser, J.A. and Sperber, W.H. (198
- Page 249 and 250:
Golden, D.A, Beuchat, L.R. and Brac
- Page 251 and 252:
humans. In Miller, A.J.,. Smith, J.
- Page 253 and 254:
Jones, F.S. and Little, R.B. (1934)
- Page 255 and 256:
Listeria innocua by oral inoculatio
- Page 257 and 258:
Low, J.C. and Donachie, W.A. (1997)
- Page 259 and 260:
McBride, M.E. and Girard, K.F. (196
- Page 261 and 262:
Nieman, R.E. and Lorber, B. (1980)
- Page 263 and 264:
Peters, M., Pohlenz, J., Jaton, K.,
- Page 265 and 266:
Bakteriologie, Mikrobiologie und Hy
- Page 267 and 268:
Seeliger, H.P.R. (1981) Apathogenic
- Page 269 and 270:
Tilney, L.G. and Portnoy, D.A. (198
- Page 271 and 272:
Walker, J.K., Morgan, J.H., McLauch
- Page 273 and 274:
APPENDIX 3 PREPARATION OF BACTERIOL
- Page 275 and 276:
Cool to 50 0 C Mix Solution A with
- Page 277 and 278:
Phosphate buffered saline (PBS; 10x
- Page 279 and 280:
APPENDIX 2 THE OVERALL RESULTS OF U
- Page 281 and 282:
Grass silage Y N OR (95% CL) p Valu
- Page 283 and 284:
storage Y N OR (95% CL) p Value cla
- Page 285 and 286:
source home made 38 182 0.6 (0.1-16
- Page 287 and 288:
source home made 34 345 0.8 (0.3-2.
- Page 289 and 290:
source barley 27 251 0.93(0.6-1.6)
- Page 291 and 292:
source potatoes 2 11 1.4 (0.-7.7) 0
- Page 293 and 294:
in a covered barn 73 595 0.8 (0.4-1
- Page 295 and 296:
sawdust 0 16 0.0 (0.0-2.73) 0.3 str
- Page 297 and 298:
APPENDIX 5 THE QUESTIONNAIRE AND TH
- Page 299 and 300:
Abbreviations: 1 first blood sampli
- Page 301 and 302:
B 113 1 114 1 115 1 116 1 117 1 118
- Page 303 and 304:
B 104 1 104 2 104 3 105 1 105 2 105
- Page 305 and 306:
B 20 1 20 2 20 3 21 1 21 2 21 3 19
- Page 307 and 308:
0.169 1.157 1.134 1.467 1.356 0.145
- Page 309 and 310:
Plate 4 Layout and ODs B 73 1 73 2
- Page 312 and 313:
UNIVERSITY OF BRISTOL LISTERIOSIS I
- Page 314 and 315:
PART C : HERD SIZE :--BETWEEN JULY
- Page 316 and 317:
(please circle one for each) 3. Wha
- Page 318 and 319:
etween which months were your milki
- Page 320 and 321:
not stored beneath the slats compos
- Page 322 and 323:
STUDY OF LISTERIOSIS IN DAIRY CATTL
- Page 324 and 325:
STUDY OF LISTERIOSIS IN DAIRY CATTL
- Page 326 and 327:
Now I would like to get some detail
- Page 328 and 329:
Root crops : ______________________
- Page 330 and 331:
In this section I will be asking qu
- Page 332 and 333:
33. Which days of the week bulk tan
- Page 334 and 335:
-what was used to treat? -what was