- Page 1 and 2: 1.0 INTRODUCTION Air pollutants are
- Page 3 and 4: The Central Pollution Control Board
- Page 5 and 6: S.No. Problem Area Type of Industry
- Page 7 and 8: (viii) High population exodus to th
- Page 9 and 10: a) Seasonal Variation in Carbon Mon
- Page 11 and 12: Concentration (µg/m 3 ) 2.2.3 Long
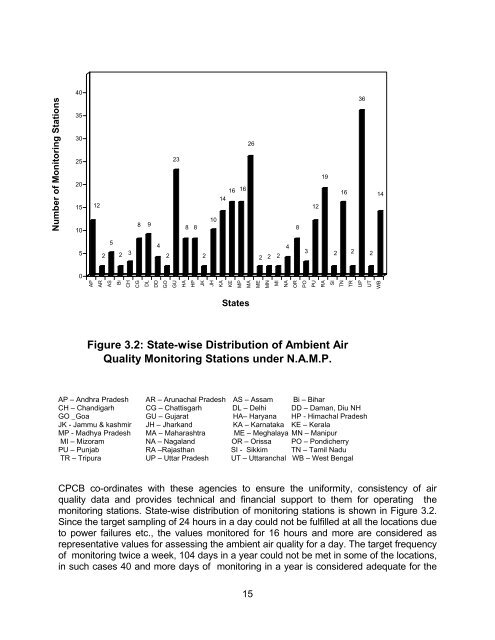
- Page 13: 3.2 National Air Monitoring Program
- Page 17 and 18: 4.0 GUIDELINES FOR MONITORING For s
- Page 19 and 20: The variability of pollutant concen
- Page 21 and 22: areas, traffic intersections etc. O
- Page 23 and 24: Station Type Description Type C Res
- Page 25 and 26: available then monitoring of specif
- Page 27 and 28: manpower and needs to be calibrated
- Page 29 and 30: averaging should be done and plotte
- Page 31 and 32: necessary to readjust the position
- Page 33 and 34: 5.0 QUALITY ASSURANCE AND QUALITY C
- Page 35 and 36: (a) Inter Laboratory Proficiency Te
- Page 37 and 38: 2. Infrastructure for conducting In
- Page 39 and 40: ZERO GAS VALVE PRESSURE REGULATOR (
- Page 41 and 42: is to assess its ability to perform
- Page 43 and 44: The mixing ratio of O3 (ppb) must n
- Page 45 and 46: (vi) Lack of Dedicated Manpower If
- Page 47 and 48: Site staff must be trained so that
- Page 50 and 51: NATIONAL AMBIENT AIR QUALITY MONITO
- Page 52 and 53: Delhi - 110 032 e-mail : cpcb@alpha
- Page 54 and 55: FOREWORD Under the Air (Prevention
- Page 56 and 57: Table No. References 161 LIST OF TA
- Page 58 and 59: 3.0 INTRODUCTION Air pollutants are
- Page 60 and 61: The Central Pollution Control Board
- Page 62 and 63: S.No. Problem Area Type of Industry
- Page 64 and 65:
(viii) High population exodus to th
- Page 66 and 67:
Monthly average of CO measured at B
- Page 68 and 69:
Concentration (µg/m 3 ) 2.2.3 Long
- Page 70 and 71:
3.2 National Air Monitoring Program
- Page 72 and 73:
Number of Monitoring Stations 40 35
- Page 74 and 75:
4.0 GUIDELINES FOR MONITORING For s
- Page 76 and 77:
The data requirements, which are re
- Page 78 and 79:
their levels and determine trends.
- Page 80 and 81:
Station Type Description traffic vo
- Page 82 and 83:
Criteria for SO2 Measurements Sourc
- Page 84 and 85:
calibration parameters change. Meas
- Page 86 and 87:
The following must be followed for
- Page 88 and 89:
changed in inclement weather. Set t
- Page 90 and 91:
5.0 QUALITY ASSURANCE AND QUALITY C
- Page 92 and 93:
(a) Inter Laboratory Proficiency Te
- Page 94 and 95:
The primary requirement for conduct
- Page 96 and 97:
ZERO GAS VALVE PRESSURE REGULATOR (
- Page 98 and 99:
is to assess its ability to perform
- Page 100 and 101:
The mixing ratio of O3 (ppb) must n
- Page 102 and 103:
(xiii) Lack of Dedicated Manpower I
- Page 104 and 105:
laboratory staff must be trained so
- Page 106 and 107:
1. AIR SAMPLING - GASEOUS 1.0 TITLE
- Page 108 and 109:
52 Fig. 1 Sampling Train
- Page 110 and 111:
54 Fig. 4 Critical Orifice Device
- Page 112 and 113:
the pollutant and accordingly selec
- Page 114 and 115:
contracts with change in humidity.
- Page 116 and 117:
and temperature has been set down i
- Page 118 and 119:
The impulse frequency emitted is pr
- Page 120 and 121:
CIRCUIT DIAGRAM - 1 64
- Page 122 and 123:
FIG. 1 (a) CIRCUIT DIAGRAM 66
- Page 124 and 125:
3. DETERMINATION OF SUSPENDED PARTI
- Page 126 and 127:
measurement precision dominates at
- Page 128 and 129:
6.4.4 Equilibration Rack - This rac
- Page 130 and 131:
Receive Filters, inspect (light tab
- Page 132 and 133:
of the face-plate. Look underneath
- Page 134 and 135:
Atmosphere". Federal Register, 52 F
- Page 136 and 137:
5.0 INTERFERENCES 5.1 Passive Depos
- Page 138 and 139:
6.4.4 Numbering Machine - Though fi
- Page 140 and 141:
chain-of-the custody log-book and o
- Page 142 and 143:
5. DETERMINATION OF SULPHUR DIOXIDE
- Page 144 and 145:
88 FIG. 1.0 SO2 SAMPLING TRAIN
- Page 146 and 147:
The wavelength calibration of the i
- Page 148 and 149:
(ii) The absorbance of the reagent
- Page 150 and 151:
pipe cleaner after use. If, the tem
- Page 152 and 153:
(A - Ao) (10 3 ) (B) C = ----------
- Page 154 and 155:
Then the air sample flows into a re
- Page 156 and 157:
integral part of the apparatus, or
- Page 158 and 159:
6.4 Pressure Regulator The output s
- Page 160 and 161:
FIG. 2 SCHEMATIC DIAGRAM OF A CALIB
- Page 162 and 163:
7. CONTINUOUS MEASUREMENT OF CARBON
- Page 164 and 165:
6.0 APPARATUS 6.1 NDIR Analyser - f
- Page 166 and 167:
BLOWER SAMPLE INLET PORT FOUR WAY V
- Page 168 and 169:
Maintain the same sample cell flow
- Page 170 and 171:
14.0 CALIBRATION PROCEDURE 14.1 Ana
- Page 172 and 173:
connected to the output manifold, t
- Page 174 and 175:
FIG. 3 MULTIPLE CYLINDER CALIBRATIO
- Page 176 and 177:
(Nondispersive Infrared Spectrometr
- Page 178 and 179:
5.0 INTERFERENCES 5.1 Nitric oxide
- Page 180 and 181:
7.1.6 Air Pump - Capable of maintai
- Page 182 and 183:
9.1.3.2 Solution B - Pipet 25 ml of
- Page 184 and 185:
9.4.7 A randomly selected 5-10% of
- Page 186 and 187:
9. CONTINUOUS MEASUREMENT OF OXIDES
- Page 188 and 189:
8.0 APPARATUS 8.1 Chemiluminescene
- Page 190 and 191:
SAMPLE INLET PUMP AIR DRYER OZONE G
- Page 192 and 193:
FIG. 3 CALIBRATION SYSTEM COMPONENT
- Page 194 and 195:
10.3.1 Flow Conditions - Insure tha
- Page 196 and 197:
ates constant. For each calibration
- Page 198 and 199:
10. DETERMINATION OF OZONE IN THE A
- Page 200 and 201:
7.0 APPARATUS 7.1 Sampling Probe -
- Page 202 and 203:
9.4 Blank Correction - Measure the
- Page 204 and 205:
11. CONTINUOUS MEASUREMENT OF OZONE
- Page 206 and 207:
FIG. 1 SCHEMATIC DIAGRAM OF A TYPIC
- Page 208 and 209:
8.2 Air Inlet Filter - A Teflon fil
- Page 210 and 211:
9.0 REAGENTS 9.1 Purity - All reage
- Page 212 and 213:
Where : Ozone Conc.CTA = the ozone
- Page 214 and 215:
1. AIR SAMPLING - GASEOUS 1.0 TITLE
- Page 216 and 217:
55 Fig. 1 Sampling Train
- Page 218 and 219:
57 Fig. 4 Critical Orifice Device
- Page 220 and 221:
the pollutant and accordingly selec
- Page 222 and 223:
(iii) Technical Data Measuring rang
- Page 224 and 225:
3.1.3 Wind Speed Temperature measur
- Page 226 and 227:
(v) Preparation for Use (a) Selecti
- Page 228 and 229:
CIRCUIT DIAGRAM - 1 67
- Page 230 and 231:
FIG. 1 (a) CIRCUIT DIAGRAM 69
- Page 232 and 233:
3. DETERMINATION OF SUSPENDED PARTI
- Page 234 and 235:
measurement precision dominates at
- Page 236 and 237:
6.4.4 Equilibration Rack - This rac
- Page 238 and 239:
Receive Filters, inspect (light tab
- Page 240 and 241:
of the face-plate. Look underneath
- Page 242 and 243:
Atmosphere". Federal Register, 52 F
- Page 244 and 245:
5.0 INTERFERENCES 5.1 Passive Depos
- Page 246 and 247:
6.4.4 Numbering Machine - Though fi
- Page 248 and 249:
chain-of-the custody log-book and o
- Page 250 and 251:
5. DETERMINATION OF SULPHUR DIOXIDE
- Page 252 and 253:
91 FIG. 1.0 SO2 SAMPLING TRAIN
- Page 254 and 255:
The wavelength calibration of the i
- Page 256 and 257:
(ii) The absorbance of the reagent
- Page 258 and 259:
pipe cleaner after use. If, the tem
- Page 260 and 261:
(A - Ao) (10 3 ) (B) C = ----------
- Page 262 and 263:
Then the air sample flows into a re
- Page 264 and 265:
integral part of the apparatus, or
- Page 266 and 267:
6.4 Pressure Regulator The output s
- Page 268 and 269:
FIG. 2 SCHEMATIC DIAGRAM OF A CALIB
- Page 270 and 271:
7. CONTINUOUS MEASUREMENT OF CARBON
- Page 272 and 273:
6.0 APPARATUS 6.2 NDIR Analyser - f
- Page 274 and 275:
BLOWER SAMPLE INLET PORT FOUR WAY V
- Page 276 and 277:
Maintain the same sample cell flow
- Page 278 and 279:
14.0 CALIBRATION PROCEDURE 14.1 Ana
- Page 280 and 281:
connected to the output manifold, t
- Page 282 and 283:
FIG. 3 MULTIPLE CYLINDER CALIBRATIO
- Page 284 and 285:
(Nondispersive Infrared Spectrometr
- Page 286 and 287:
5.0 INTERFERENCES 5.1 Nitric oxide
- Page 288 and 289:
7.1.6 Air Pump - Capable of maintai
- Page 290 and 291:
9.1.3.2 Solution B - Pipet 25 ml of
- Page 292 and 293:
9.4.7 A randomly selected 5-10% of
- Page 294 and 295:
9. CONTINUOUS MEASUREMENT OF OXIDES
- Page 296 and 297:
9.0 APPARATUS 8.1 Chemiluminescene
- Page 298 and 299:
SAMPLE INLET PUMP AIR DRYER OZONE G
- Page 300 and 301:
FIG. 3 CALIBRATION SYSTEM COMPONENT
- Page 302 and 303:
10.6.1 Flow Conditions - Insure tha
- Page 304 and 305:
ates constant. For each calibration
- Page 306 and 307:
10. DETERMINATION OF OZONE IN THE A
- Page 308 and 309:
7.0 APPARATUS 7.1 Sampling Probe -
- Page 310 and 311:
9.4 Blank Correction - Measure the
- Page 312 and 313:
11. CONTINUOUS MEASUREMENT OF OZONE
- Page 314 and 315:
FIG. 1 SCHEMATIC DIAGRAM OF A TYPIC
- Page 316 and 317:
8.2 Air Inlet Filter - A Teflon fil
- Page 318 and 319:
9.0 REAGENTS 9.3 Purity - All reage
- Page 320 and 321:
Where : Ozone Conc.CTA = the ozone