Evaluation of Electric Vehicles as an Alternative for Work Trip and ...
Evaluation of Electric Vehicles as an Alternative for Work Trip and ...
Evaluation of Electric Vehicles as an Alternative for Work Trip and ...

Create successful ePaper yourself
Turn your PDF publications into a flip-book with our unique Google optimized e-Paper software.
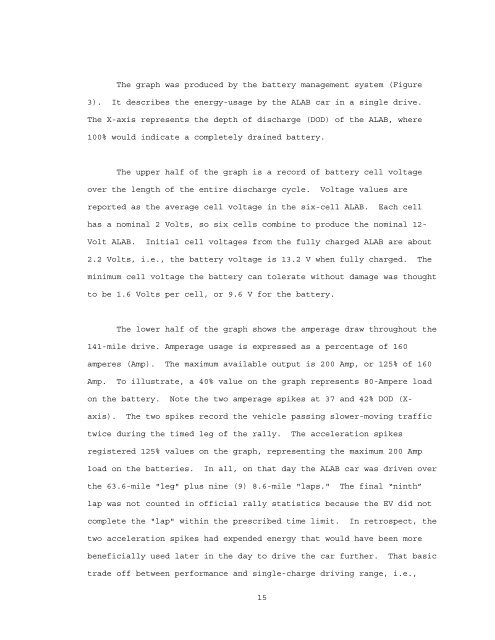
The graph w<strong>as</strong> produced by the battery m<strong>an</strong>agement system (Figure<br />
3). It describes the energy-usage by the ALAB car in a single drive.<br />
The X-axis represents the depth <strong>of</strong> discharge (DOD) <strong>of</strong> the ALAB, where<br />
100% would indicate a completely drained battery.<br />
The upper half <strong>of</strong> the graph is a record <strong>of</strong> battery cell voltage<br />
over the length <strong>of</strong> the entire discharge cycle. Voltage values are<br />
reported <strong>as</strong> the average cell voltage in the six-cell ALAB. Each cell<br />
h<strong>as</strong> a nominal 2 Volts, so six cells combine to produce the nominal 12-<br />
Volt ALAB. Initial cell voltages from the fully charged ALAB are about<br />
2.2 Volts, i.e., the battery voltage is 13.2 V when fully charged. The<br />
minimum cell voltage the battery c<strong>an</strong> tolerate without damage w<strong>as</strong> thought<br />
to be 1.6 Volts per cell, or 9.6 V <strong>for</strong> the battery.<br />
The lower half <strong>of</strong> the graph shows the amperage draw throughout the<br />
141-mile drive. Amperage usage is expressed <strong>as</strong> a percentage <strong>of</strong> 160<br />
amperes (Amp). The maximum available output is 200 Amp, or 125% <strong>of</strong> 160<br />
Amp. To illustrate, a 40% value on the graph represents 80-Ampere load<br />
on the battery. Note the two amperage spikes at 37 <strong>an</strong>d 42% DOD (X-<br />
axis). The two spikes record the vehicle p<strong>as</strong>sing slower-moving traffic<br />
twice during the timed leg <strong>of</strong> the rally. The acceleration spikes<br />
registered 125% values on the graph, representing the maximum 200 Amp<br />
load on the batteries. In all, on that day the ALAB car w<strong>as</strong> driven over<br />
the 63.6-mile "leg" plus nine (9) 8.6-mile "laps." The final “ninth”<br />
lap w<strong>as</strong> not counted in <strong>of</strong>ficial rally statistics because the EV did not<br />
complete the "lap" within the prescribed time limit. In retrospect, the<br />
two acceleration spikes had expended energy that would have been more<br />
beneficially used later in the day to drive the car further. That b<strong>as</strong>ic<br />
trade <strong>of</strong>f between per<strong>for</strong>m<strong>an</strong>ce <strong>an</strong>d single-charge driving r<strong>an</strong>ge, i.e.,<br />
15