Evaluation of Electric Vehicles as an Alternative for Work Trip and ...
Evaluation of Electric Vehicles as an Alternative for Work Trip and ...
Evaluation of Electric Vehicles as an Alternative for Work Trip and ...

You also want an ePaper? Increase the reach of your titles
YUMPU automatically turns print PDFs into web optimized ePapers that Google loves.
efficiency, w<strong>as</strong> clearly illustrated through data collected in the ATdS.<br />
More detailed data <strong>an</strong>d in<strong>for</strong>mation about the daily per<strong>for</strong>m<strong>an</strong>ce <strong>of</strong> the<br />
ALAB car at the 1996 ATdS is provided in the project’s Web site, which<br />
is included in this report <strong>as</strong> Appendix B.<br />
Immediately following the ATdS, on May 20, 1996, the eighteen-<br />
month (18) commuter <strong>an</strong>d work-trip element <strong>of</strong> the evaluation w<strong>as</strong><br />
initiated. Instrument data <strong>an</strong>d narratives <strong>of</strong> signific<strong>an</strong>t events were<br />
recorded in accord<strong>an</strong>ce with vehicle demonstration project requirements<br />
<strong>an</strong>d submitted monthly to Rideshare. Beginning on June 7, 1996, the ALAB<br />
car lost about ten percent <strong>of</strong> its driving r<strong>an</strong>ge. At roughly two-week<br />
intervals, the battery capacity dropped in successive 10% increments<br />
until on July 29 the daily commuter/work-trip evaluation w<strong>as</strong> suspended.<br />
At that point the r<strong>an</strong>ge <strong>of</strong> the car had diminished to 10 miles (16 Km)<br />
(see Figure 5).<br />
Dist<strong>an</strong>ce (miles)<br />
160<br />
140<br />
120<br />
100<br />
80<br />
60<br />
40<br />
20<br />
0<br />
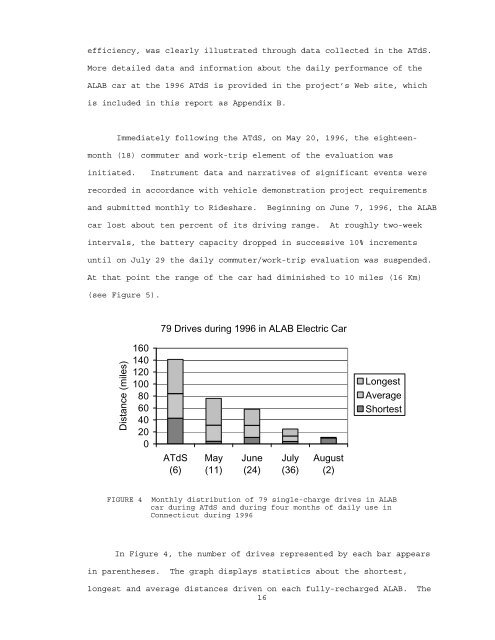
79 Drives during 1996 in ALAB <strong>Electric</strong> Car<br />
ATdS<br />
(6)<br />
May<br />
(11)<br />
June<br />
(24)<br />
July<br />
(36)<br />
August<br />
(2)<br />
Longest<br />
Average<br />
Shortest<br />
FIGURE 4 Monthly distribution <strong>of</strong> 79 single-charge drives in ALAB<br />
car during ATdS <strong>an</strong>d during four months <strong>of</strong> daily use in<br />
Connecticut during 1996<br />
In Figure 4, the number <strong>of</strong> drives represented by each bar appears<br />
in parentheses. The graph displays statistics about the shortest,<br />
longest <strong>an</strong>d average dist<strong>an</strong>ces driven on each fully-recharged ALAB. The<br />
16