GAMMON INDIA LIMITED
GAMMON INDIA LIMITED
GAMMON INDIA LIMITED
You also want an ePaper? Increase the reach of your titles
YUMPU automatically turns print PDFs into web optimized ePapers that Google loves.
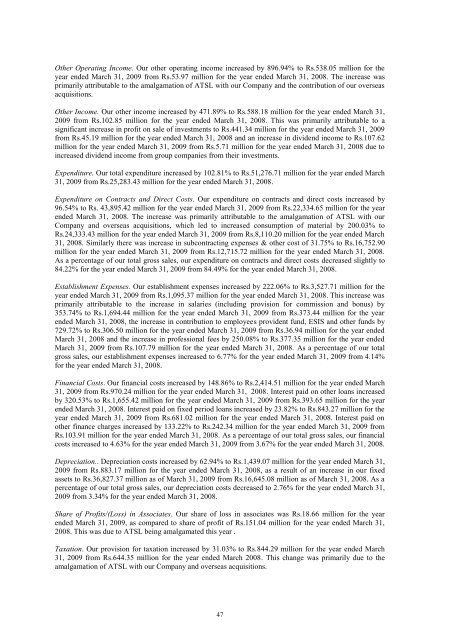
Other Operating Income. Our other operating income increased by 896.94% to Rs.538.05 million for the<br />
year ended March 31, 2009 from Rs.53.97 million for the year ended March 31, 2008. The increase was<br />
primarily attributable to the amalgamation of ATSL with our Company and the contribution of our overseas<br />
acquisitions.<br />
Other Income. Our other income increased by 471.89% to Rs.588.18 million for the year ended March 31,<br />
2009 from Rs.102.85 million for the year ended March 31, 2008. This was primarily attributable to a<br />
significant increase in profit on sale of investments to Rs.441.34 million for the year ended March 31, 2009<br />
from Rs.45.19 million for the year ended March 31, 2008 and an increase in dividend income to Rs.107.62<br />
million for the year ended March 31, 2009 from Rs.5.71 million for the year ended March 31, 2008 due to<br />
increased dividend income from group companies from their investments.<br />
Expenditure. Our total expenditure increased by 102.81% to Rs.51,276.71 million for the year ended March<br />
31, 2009 from Rs.25,283.43 million for the year ended March 31, 2008.<br />
Expenditure on Contracts and Direct Costs. Our expenditure on contracts and direct costs increased by<br />
96.54% to Rs. 43,895.42 million for the year ended March 31, 2009 from Rs.22,334.65 million for the year<br />
ended March 31, 2008. The increase was primarily attributable to the amalgamation of ATSL with our<br />
Company and overseas acquisitions, which led to increased consumption of material by 200.03% to<br />
Rs.24,333.43 million for the year ended March 31, 2009 from Rs.8,110.20 million for the year ended March<br />
31, 2008. Similarly there was increase in subcontracting expenses & other cost of 31.75% to Rs.16,752.90<br />
million for the year ended March 31, 2009 from Rs.12,715.72 million for the year ended March 31, 2008.<br />
As a percentage of our total gross sales, our expenditure on contracts and direct costs decreased slightly to<br />
84.22% for the year ended March 31, 2009 from 84.49% for the year ended March 31, 2008.<br />
Establishment Expenses. Our establishment expenses increased by 222.06% to Rs.3,527.71 million for the<br />
year ended March 31, 2009 from Rs.1,095.37 million for the year ended March 31, 2008. This increase was<br />
primarily attributable to the increase in salaries (including provision for commission and bonus) by<br />
353.74% to Rs.1,694.44 million for the year ended March 31, 2009 from Rs.373.44 million for the year<br />
ended March 31, 2008, the increase in contribution to employees provident fund, ESIS and other funds by<br />
729.72% to Rs.306.50 million for the year ended March 31, 2009 from Rs.36.94 million for the year ended<br />
March 31, 2008 and the increase in professional fees by 250.08% to Rs.377.35 million for the year ended<br />
March 31, 2009 from Rs.107.79 million for the year ended March 31, 2008. As a percentage of our total<br />
gross sales, our establishment expenses increased to 6.77% for the year ended March 31, 2009 from 4.14%<br />
for the year ended March 31, 2008.<br />
Financial Costs. Our financial costs increased by 148.86% to Rs.2,414.51 million for the year ended March<br />
31, 2009 from Rs.970.24 million for the year ended March 31, 2008. Interest paid on other loans increased<br />
by 320.53% to Rs.1,655.42 million for the year ended March 31, 2009 from Rs.393.65 million for the year<br />
ended March 31, 2008. Interest paid on fixed period loans increased by 23.82% to Rs.843.27 million for the<br />
year ended March 31, 2009 from Rs.681.02 million for the year ended March 31, 2008. Interest paid on<br />
other finance charges increased by 133.22% to Rs.242.34 million for the year ended March 31, 2009 from<br />
Rs.103.91 million for the year ended March 31, 2008. As a percentage of our total gross sales, our financial<br />
costs increased to 4.63% for the year ended March 31, 2009 from 3.67% for the year ended March 31, 2008.<br />
Depreciation.. Depreciation costs increased by 62.94% to Rs.1,439.07 million for the year ended March 31,<br />
2009 from Rs.883.17 million for the year ended March 31, 2008, as a result of an increase in our fixed<br />
assets to Rs.36,827.37 million as of March 31, 2009 from Rs.16,645.08 million as of March 31, 2008. As a<br />
percentage of our total gross sales, our depreciation costs decreased to 2.76% for the year ended March 31,<br />
2009 from 3.34% for the year ended March 31, 2008.<br />
Share of Profits/(Loss) in Associates. Our share of loss in associates was Rs.18.66 million for the year<br />
ended March 31, 2009, as compared to share of profit of Rs.151.04 million for the year ended March 31,<br />
2008. This was due to ATSL being amalgamated this year .<br />
Taxation. Our provision for taxation increased by 31.03% to Rs.844.29 million for the year ended March<br />
31, 2009 from Rs.644.35 million for the year ended March 2008. This change was primarily due to the<br />
amalgamation of ATSL with our Company and overseas acquisitions.<br />
47


