Stefan Wirtz Vom Fachbereich VI (Geographie/Geowissenschaften ...
Stefan Wirtz Vom Fachbereich VI (Geographie/Geowissenschaften ...
Stefan Wirtz Vom Fachbereich VI (Geographie/Geowissenschaften ...

You also want an ePaper? Increase the reach of your titles
YUMPU automatically turns print PDFs into web optimized ePapers that Google loves.
Experimentelle Rinnenerosionsforschung vs. Modellkonzepte – Quantifizierung der hydraulischen und erosiven Wirksamkeit von Rinnen<br />
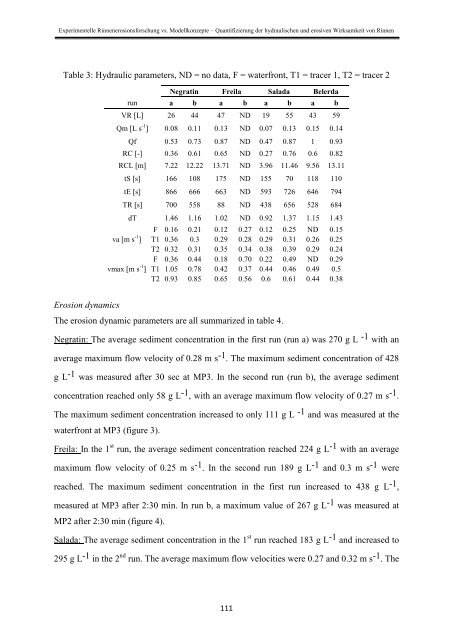
Table 3: Hydraulic parameters, ND = no data, F = waterfront, T1 = tracer 1, T2 = tracer 2<br />
Negratin Freila Salada Belerda<br />
run a b a b a b a b<br />
VR [L] 26 44 47 ND 19 55 43 59<br />
Qm [L s -1 ] 0.08 0.11 0.13 ND 0.07 0.13 0.15 0.14<br />
Qf 0.53 0.73 0.87 ND 0.47 0.87 1 0.93<br />
RC [-] 0.36 0.61 0.65 ND 0.27 0.76 0.6 0.82<br />
RCL [m] 7.22 12.22 13.71 ND 3.96 11.46 9.56 13.11<br />
tS [s] 166 108 175 ND 155 70 118 110<br />
tE [s] 866 666 663 ND 593 726 646 794<br />
TR [s] 700 558 88 ND 438 656 528 684<br />
va [m s -1 ]<br />
vmax [m s -1 ]<br />
dT 1.46 1.16 1.02 ND 0.92 1.37 1.15 1.43<br />
F 0.16 0.21 0.12 0.27 0.12 0.25 ND 0.15<br />
T1 0.36 0.3 0.29 0.28 0.29 0.31 0.26 0.25<br />
T2 0.32 0.31 0.35 0.34 0.38 0.39 0.29 0.24<br />
F 0.36 0.44 0.18 0.70 0.22 0.49 ND 0.29<br />
T1 1.05 0.78 0.42 0.37 0.44 0.46 0.49 0.5<br />
T2 0.93 0.85 0.65 0.56 0.6 0.61 0.44 0.38<br />
Erosion dynamics<br />
The erosion dynamic parameters are all summarized in table 4.<br />
Negratin: The average sediment concentration in the first run (run a) was 270 g L -1 with an<br />
average maximum flow velocity of 0.28 m s -1 . The maximum sediment concentration of 428<br />
g L -1 was measured after 30 sec at MP3. In the second run (run b), the average sediment<br />
concentration reached only 58 g L -1 , with an average maximum flow velocity of 0.27 m s -1 .<br />
The maximum sediment concentration increased to only 111 g L -1 and was measured at the<br />
waterfront at MP3 (figure 3).<br />
Freila: In the 1 st run, the average sediment concentration reached 224 g L -1 with an average<br />
maximum flow velocity of 0.25 m s -1 . In the second run 189 g L -1 and 0.3 m s -1 were<br />
reached. The maximum sediment concentration in the first run increased to 438 g L -1 ,<br />
measured at MP3 after 2:30 min. In run b, a maximum value of 267 g L -1 was measured at<br />
MP2 after 2:30 min (figure 4).<br />
Salada: The average sediment concentration in the 1 st run reached 183 g L -1 and increased to<br />
295 g L -1 in the 2 nd run. The average maximum flow velocities were 0.27 and 0.32 m s -1 . The<br />
111