Stefan Wirtz Vom Fachbereich VI (Geographie/Geowissenschaften ...
Stefan Wirtz Vom Fachbereich VI (Geographie/Geowissenschaften ...
Stefan Wirtz Vom Fachbereich VI (Geographie/Geowissenschaften ...

You also want an ePaper? Increase the reach of your titles
YUMPU automatically turns print PDFs into web optimized ePapers that Google loves.
Experimentelle Rinnenerosionsforschung vs. Modellkonzepte – Quantifizierung der hydraulischen und erosiven Wirksamkeit von Rinnen<br />
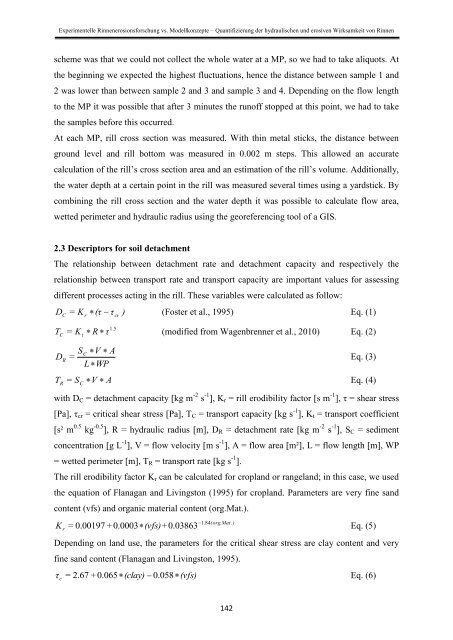
scheme was that we could not collect the whole water at a MP, so we had to take aliquots. At<br />
the beginning we expected the highest fluctuations, hence the distance between sample 1 and<br />
2 was lower than between sample 2 and 3 and sample 3 and 4. Depending on the flow length<br />
to the MP it was possible that after 3 minutes the runoff stopped at this point, we had to take<br />
the samples before this occurred.<br />
At each MP, rill cross section was measured. With thin metal sticks, the distance between<br />
ground level and rill bottom was measured in 0.002 m steps. This allowed an accurate<br />
calculation of the rill’s cross section area and an estimation of the rill’s volume. Additionally,<br />
the water depth at a certain point in the rill was measured several times using a yardstick. By<br />
combining the rill cross section and the water depth it was possible to calculate flow area,<br />
wetted perimeter and hydraulic radius using the georeferencing tool of a GIS.<br />
2.3 Descriptors for soil detachment<br />
The relationship between detachment rate and detachment capacity and respectively the<br />
relationship between transport rate and transport capacity are important values for assessing<br />
different processes acting in the rill. These variables were calculated as follow:<br />
DC = K<br />
r<br />
(τ τcr<br />
) (Foster et al., 1995) Eq. (1)<br />
T<br />
1.5<br />
C<br />
= K<br />
t<br />
R τ<br />
(modified from Wagenbrenner et al., 2010) Eq. (2)<br />
SC<br />
V A<br />
DR =<br />
Eq. (3)<br />
L WP<br />
TR = SC<br />
V A<br />
Eq. (4)<br />
with D C = detachment capacity [kg m -2 s -1 ], K r = rill erodibility factor [s m -1 ], τ = shear stress<br />
[Pa], τ cr = critical shear stress [Pa], T C = transport capacity [kg s -1 ], K t = transport coefficient<br />
[s² m 0.5 kg -0.5 ], R = hydraulic radius [m], D R = detachment rate [kg m -2 s -1 ], S C = sediment<br />
concentration [g L -1 ], V = flow velocity [m s -1 ], A = flow area [m²], L = flow length [m], WP<br />
= wetted perimeter [m], T R = transport rate [kg s -1 ].<br />
The rill erodibility factor K r can be calculated for cropland or rangeland; in this case, we used<br />
the equation of Flanagan and Livingston (1995) for cropland. Parameters are very fine sand<br />
content (vfs) and organic material content (org.Mat.).<br />
K<br />
1.84(org.<br />
Mat.<br />
)<br />
r<br />
= 0.00197 + 0.0003 (vfs) + 0.03863<br />
Eq. (5)<br />
Depending on land use, the parameters for the critical shear stress are clay content and very<br />
fine sand content (Flanagan and Livingston, 1995).<br />
τ c<br />
= 2.67 + 0.065 (clay) 0.058 (vfs)<br />
Eq. (6)<br />
142