Stefan Wirtz Vom Fachbereich VI (Geographie/Geowissenschaften ...
Stefan Wirtz Vom Fachbereich VI (Geographie/Geowissenschaften ...
Stefan Wirtz Vom Fachbereich VI (Geographie/Geowissenschaften ...

Create successful ePaper yourself
Turn your PDF publications into a flip-book with our unique Google optimized e-Paper software.
Experimentelle Rinnenerosionsforschung vs. Modellkonzepte – Quantifizierung der hydraulischen und erosiven Wirksamkeit von Rinnen<br />
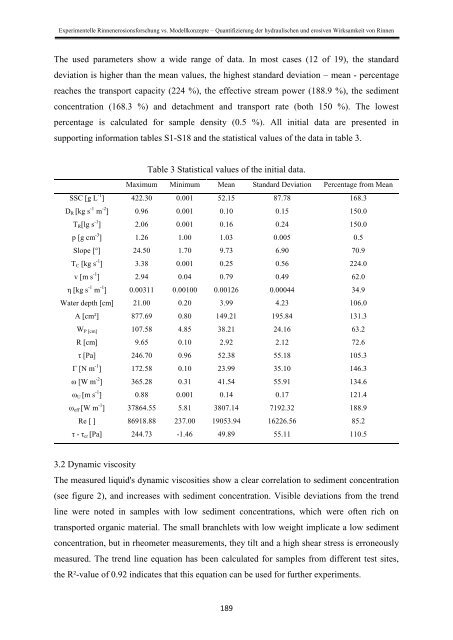
The used parameters show a wide range of data. In most cases (12 of 19), the standard<br />
deviation is higher than the mean values, the highest standard deviation – mean - percentage<br />
reaches the transport capacity (224 %), the effective stream power (188.9 %), the sediment<br />
concentration (168.3 %) and detachment and transport rate (both 150 %). The lowest<br />
percentage is calculated for sample density (0.5 %). All initial data are presented in<br />
supporting information tables S1-S18 and the statistical values of the data in table 3.<br />
Table 3 Statistical values of the initial data.<br />
Maximum Minimum Mean Standard Deviation Percentage from Mean<br />
SSC [g L -1 ] 422.30 0.001 52.15 87.78 168.3<br />
D R [kg s -1 m -2 ] 0.96 0.001 0.10 0.15 150.0<br />
T R [lg s -1 ] 2.06 0.001 0.16 0.24 150.0<br />
р [g cm -3 ] 1.26 1.00 1.03 0.005 0.5<br />
Slope [°] 24.50 1.70 9.73 6.90 70.9<br />
T C [kg s -1 ] 3.38 0.001 0.25 0.56 224.0<br />
v [m s -1 ] 2.94 0.04 0.79 0.49 62.0<br />
η [kg s -1 m -1 ] 0.00311 0.00100 0.00126 0.00044 34.9<br />
Water depth [cm] 21.00 0.20 3.99 4.23 106.0<br />
A [cm²] 877.69 0.80 149.21 195.84 131.3<br />
W P [cm] 107.58 4.85 38.21 24.16 63.2<br />
R [cm] 9.65 0.10 2.92 2.12 72.6<br />
τ [Pa] 246.70 0.96 52.38 55.18 105.3<br />
Г [N m -1 ] 172.58 0.10 23.99 35.10 146.3<br />
ω [W m -2 ] 365.28 0.31 41.54 55.91 134.6<br />
ω U [m s -1 ] 0.88 0.001 0.14 0.17 121.4<br />
ω eff [W m -1 ] 37864.55 5.81 3807.14 7192.32 188.9<br />
Re [ ] 86918.88 237.00 19053.94 16226.56 85.2<br />
τ - τ cr [Pa] 244.73 -1.46 49.89 55.11 110.5<br />
3.2 Dynamic viscosity<br />
The measured liquid's dynamic viscosities show a clear correlation to sediment concentration<br />
(see figure 2), and increases with sediment concentration. Visible deviations from the trend<br />
line were noted in samples with low sediment concentrations, which were often rich on<br />
transported organic material. The small branchlets with low weight implicate a low sediment<br />
concentration, but in rheometer measurements, they tilt and a high shear stress is erroneously<br />
measured. The trend line equation has been calculated for samples from different test sites,<br />
the R²-value of 0.92 indicates that this equation can be used for further experiments.<br />
189