Stefan Wirtz Vom Fachbereich VI (Geographie/Geowissenschaften ...
Stefan Wirtz Vom Fachbereich VI (Geographie/Geowissenschaften ...
Stefan Wirtz Vom Fachbereich VI (Geographie/Geowissenschaften ...

Create successful ePaper yourself
Turn your PDF publications into a flip-book with our unique Google optimized e-Paper software.
Experimentelle Rinnenerosionsforschung vs. Modellkonzepte – Quantifizierung der hydraulischen und erosiven Wirksamkeit von Rinnen<br />
likelihood classifier was chosen. After classification of every single tile, a mosaic was<br />
calculated.<br />
3 Results and Interpretation<br />
3.1 Rill experiments<br />
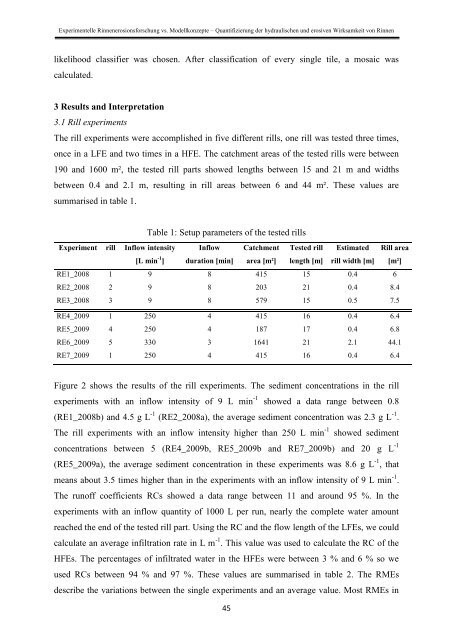
The rill experiments were accomplished in five different rills, one rill was tested three times,<br />
once in a LFE and two times in a HFE. The catchment areas of the tested rills were between<br />
190 and 1600 m², the tested rill parts showed lengths between 15 and 21 m and widths<br />
between 0.4 and 2.1 m, resulting in rill areas between 6 and 44 m². These values are<br />
summarised in table 1.<br />
Table 1: Setup parameters of the tested rills<br />
Experiment rill Inflow intensity Inflow Catchment Tested rill Estimated Rill area<br />
[L min -1 ] duration [min] area [m²] length [m] rill width [m] [m²]<br />
RE1_2008 1 9 8 415 15 0.4 6<br />
RE2_2008 2 9 8 203 21 0.4 8.4<br />
RE3_2008 3 9 8 579 15 0.5 7.5<br />
RE4_2009 1 250 4 415 16 0.4 6.4<br />
RE5_2009 4 250 4 187 17 0.4 6.8<br />
RE6_2009 5 330 3 1641 21 2.1 44.1<br />
RE7_2009 1 250 4 415 16 0.4 6.4<br />
Figure 2 shows the results of the rill experiments. The sediment concentrations in the rill<br />
experiments with an inflow intensity of 9 L min -1 showed a data range between 0.8<br />
(RE1_2008b) and 4.5 g L -1 (RE2_2008a), the average sediment concentration was 2.3 g L -1 .<br />
The rill experiments with an inflow intensity higher than 250 L min -1 showed sediment<br />
concentrations between 5 (RE4_2009b, RE5_2009b and RE7_2009b) and 20 g L -1<br />
(RE5_2009a), the average sediment concentration in these experiments was 8.6 g L -1 , that<br />
means about 3.5 times higher than in the experiments with an inflow intensity of 9 L min -1 .<br />
The runoff coefficients RCs showed a data range between 11 and around 95 %. In the<br />
experiments with an inflow quantity of 1000 L per run, nearly the complete water amount<br />
reached the end of the tested rill part. Using the RC and the flow length of the LFEs, we could<br />
calculate an average infiltration rate in L m -1 . This value was used to calculate the RC of the<br />
HFEs. The percentages of infiltrated water in the HFEs were between 3 % and 6 % so we<br />
used RCs between 94 % and 97 %. These values are summarised in table 2. The RMEs<br />
describe the variations between the single experiments and an average value. Most RMEs in<br />
45