Stefan Wirtz Vom Fachbereich VI (Geographie/Geowissenschaften ...
Stefan Wirtz Vom Fachbereich VI (Geographie/Geowissenschaften ...
Stefan Wirtz Vom Fachbereich VI (Geographie/Geowissenschaften ...

Create successful ePaper yourself
Turn your PDF publications into a flip-book with our unique Google optimized e-Paper software.
Experimentelle Rinnenerosionsforschung vs. Modellkonzepte – Quantifizierung der hydraulischen und erosiven Wirksamkeit von Rinnen<br />
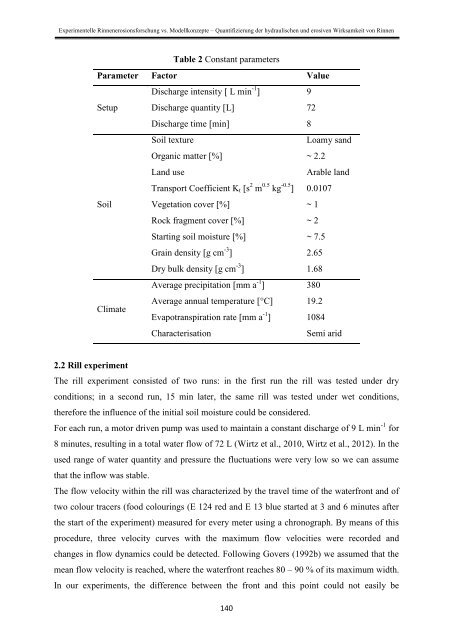
Table 2 Constant parameters<br />
Parameter Factor Value<br />
Discharge intensity [ L min -1 ] 9<br />
Setup Discharge quantity [L] 72<br />
Discharge time [min] 8<br />
Soil texture<br />
Loamy sand<br />
Organic matter [%] ~ 2.2<br />
Land use<br />
Arable land<br />
Transport Coefficient K t [s 2 m 0.5 kg -0.5 ] 0.0107<br />
Soil Vegetation cover [%] ~ 1<br />
Rock fragment cover [%] ~ 2<br />
Starting soil moisture [%] ~ 7.5<br />
Grain density [g cm -3 ] 2.65<br />
Dry bulk density [g cm -3 ] 1.68<br />
Average precipitation [mm a -1 ] 380<br />
Climate<br />
Average annual temperature [°C] 19.2<br />
Evapotranspiration rate [mm a -1 ] 1084<br />
Characterisation<br />
Semi arid<br />
2.2 Rill experiment<br />
The rill experiment consisted of two runs: in the first run the rill was tested under dry<br />
conditions; in a second run, 15 min later, the same rill was tested under wet conditions,<br />
therefore the influence of the initial soil moisture could be considered.<br />
For each run, a motor driven pump was used to maintain a constant discharge of 9 L min -1 for<br />
8 minutes, resulting in a total water flow of 72 L (<strong>Wirtz</strong> et al., 2010, <strong>Wirtz</strong> et al., 2012). In the<br />
used range of water quantity and pressure the fluctuations were very low so we can assume<br />
that the inflow was stable.<br />
The flow velocity within the rill was characterized by the travel time of the waterfront and of<br />
two colour tracers (food colourings (E 124 red and E 13 blue started at 3 and 6 minutes after<br />
the start of the experiment) measured for every meter using a chronograph. By means of this<br />
procedure, three velocity curves with the maximum flow velocities were recorded and<br />
changes in flow dynamics could be detected. Following Govers (1992b) we assumed that the<br />
mean flow velocity is reached, where the waterfront reaches 80 – 90 % of its maximum width.<br />
In our experiments, the difference between the front and this point could not easily be<br />
140