Stefan Wirtz Vom Fachbereich VI (Geographie/Geowissenschaften ...
Stefan Wirtz Vom Fachbereich VI (Geographie/Geowissenschaften ...
Stefan Wirtz Vom Fachbereich VI (Geographie/Geowissenschaften ...

Create successful ePaper yourself
Turn your PDF publications into a flip-book with our unique Google optimized e-Paper software.
Experimentelle Rinnenerosionsforschung vs. Modellkonzepte – Quantifizierung der hydraulischen und erosiven Wirksamkeit von Rinnen<br />
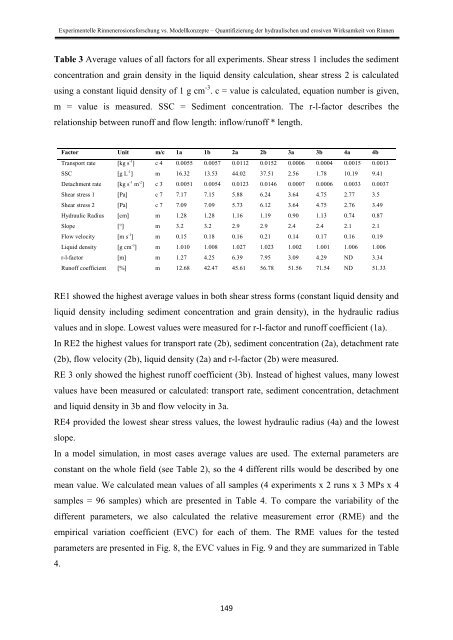
Table 3 Average values of all factors for all experiments. Shear stress 1 includes the sediment<br />
concentration and grain density in the liquid density calculation, shear stress 2 is calculated<br />
using a constant liquid density of 1 g cm -3 . c = value is calculated, equation number is given,<br />
m = value is measured. SSC = Sediment concentration. The r-l-factor describes the<br />
relationship between runoff and flow length: inflow/runoff * length.<br />
Factor Unit m/c 1a 1b 2a 2b 3a 3b 4a 4b<br />
Transport rate [kg s -1 ] c 4 0.0055 0.0057 0.0112 0.0152 0.0006 0.0004 0.0015 0.0013<br />
SSC [g L -1 ] m 16.32 13.53 44.02 37.51 2.56 1.78 10.19 9.41<br />
Detachment rate [kg s -1 m -2 ] c 3 0.0051 0.0054 0.0123 0.0146 0.0007 0.0006 0.0033 0.0037<br />
Shear stress 1 [Pa] c 7 7.17 7.15 5.88 6.24 3.64 4.75 2.77 3.5<br />
Shear stress 2 [Pa] c 7 7.09 7.09 5.73 6.12 3.64 4.75 2.76 3.49<br />
Hydraulic Radius [cm] m 1.28 1.28 1.16 1.19 0.90 1.13 0.74 0.87<br />
Slope [°] m 3.2 3.2 2.9 2.9 2.4 2.4 2.1 2.1<br />
Flow velocity [m s -1 ] m 0.15 0.18 0.16 0.21 0.14 0.17 0.16 0.19<br />
Liquid density [g cm -3 ] m 1.010 1.008 1.027 1.023 1.002 1.001 1.006 1.006<br />
r-l-factor [m] m 1.27 4.25 6.39 7.95 3.09 4.29 ND 3.34<br />
Runoff coefficient [%] m 12.68 42.47 45.61 56.78 51.56 71.54 ND 51.33<br />
RE1 showed the highest average values in both shear stress forms (constant liquid density and<br />
liquid density including sediment concentration and grain density), in the hydraulic radius<br />
values and in slope. Lowest values were measured for r-l-factor and runoff coefficient (1a).<br />
In RE2 the highest values for transport rate (2b), sediment concentration (2a), detachment rate<br />
(2b), flow velocity (2b), liquid density (2a) and r-l-factor (2b) were measured.<br />
RE 3 only showed the highest runoff coefficient (3b). Instead of highest values, many lowest<br />
values have been measured or calculated: transport rate, sediment concentration, detachment<br />
and liquid density in 3b and flow velocity in 3a.<br />
RE4 provided the lowest shear stress values, the lowest hydraulic radius (4a) and the lowest<br />
slope.<br />
In a model simulation, in most cases average values are used. The external parameters are<br />
constant on the whole field (see Table 2), so the 4 different rills would be described by one<br />
mean value. We calculated mean values of all samples (4 experiments x 2 runs x 3 MPs x 4<br />
samples = 96 samples) which are presented in Table 4. To compare the variability of the<br />
different parameters, we also calculated the relative measurement error (RME) and the<br />
empirical variation coefficient (EVC) for each of them. The RME values for the tested<br />
parameters are presented in Fig. 8, the EVC values in Fig. 9 and they are summarized in Table<br />
4.<br />
149