Stefan Wirtz Vom Fachbereich VI (Geographie/Geowissenschaften ...
Stefan Wirtz Vom Fachbereich VI (Geographie/Geowissenschaften ...
Stefan Wirtz Vom Fachbereich VI (Geographie/Geowissenschaften ...

You also want an ePaper? Increase the reach of your titles
YUMPU automatically turns print PDFs into web optimized ePapers that Google loves.
Experimentelle Rinnenerosionsforschung vs. Modellkonzepte – Quantifizierung der hydraulischen und erosiven Wirksamkeit von Rinnen<br />
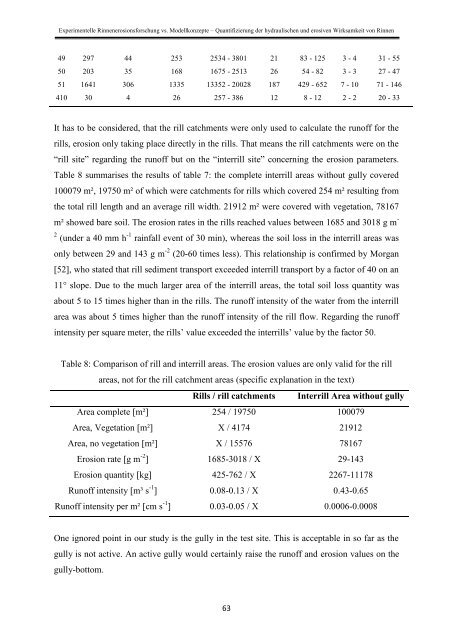
49 297 44 253 2534 - 3801 21 83 - 125 3 - 4 31 - 55<br />
50 203 35 168 1675 - 2513 26 54 - 82 3 - 3 27 - 47<br />
51 1641 306 1335 13352 - 20028 187 429 - 652 7 - 10 71 - 146<br />
410 30 4 26 257 - 386 12 8 - 12 2 - 2 20 - 33<br />
It has to be considered, that the rill catchments were only used to calculate the runoff for the<br />
rills, erosion only taking place directly in the rills. That means the rill catchments were on the<br />
“rill site” regarding the runoff but on the “interrill site” concerning the erosion parameters.<br />
Table 8 summarises the results of table 7: the complete interrill areas without gully covered<br />
100079 m², 19750 m² of which were catchments for rills which covered 254 m² resulting from<br />
the total rill length and an average rill width. 21912 m² were covered with vegetation, 78167<br />
m² showed bare soil. The erosion rates in the rills reached values between 1685 and 3018 g m -<br />
2 (under a 40 mm h -1 rainfall event of 30 min), whereas the soil loss in the interrill areas was<br />
only between 29 and 143 g m -2 (20-60 times less). This relationship is confirmed by Morgan<br />
[52], who stated that rill sediment transport exceeded interrill transport by a factor of 40 on an<br />
11° slope. Due to the much larger area of the interrill areas, the total soil loss quantity was<br />
about 5 to 15 times higher than in the rills. The runoff intensity of the water from the interrill<br />
area was about 5 times higher than the runoff intensity of the rill flow. Regarding the runoff<br />
intensity per square meter, the rills’ value exceeded the interrills’ value by the factor 50.<br />
Table 8: Comparison of rill and interrill areas. The erosion values are only valid for the rill<br />
areas, not for the rill catchment areas (specific explanation in the text)<br />
Rills / rill catchments Interrill Area without gully<br />
Area complete [m²] 254 / 19750 100079<br />
Area, Vegetation [m²] X / 4174 21912<br />
Area, no vegetation [m²] X / 15576 78167<br />
Erosion rate [g m -2 ] 1685-3018 / X 29-143<br />
Erosion quantity [kg] 425-762 / X 2267-11178<br />
Runoff intensity [m³ s -1 ] 0.08-0.13 / X 0.43-0.65<br />
Runoff intensity per m² [cm s -1 ] 0.03-0.05 / X 0.0006-0.0008<br />
One ignored point in our study is the gully in the test site. This is acceptable in so far as the<br />
gully is not active. An active gully would certainly raise the runoff and erosion values on the<br />
gully-bottom.<br />
63