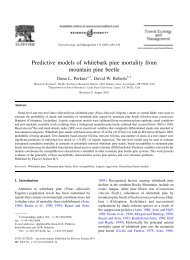
THE NORTHERN RANGE 36 Data were gathered for two standard rangeland measures. One was net aboveground production. This is the total of all green annual production for the growing season, and includes an estimate of the production that is removed by grazing ungulates during the growing period. A second measure taken was peak standing crop biomass. This single measure includes the total vegetation biomass produced during the current season still standing at the peak of the growing season. Peak: standing crop biomass on summer range was not correlated with elk numbers. Biomass fluctuations apparently were related to climate and snowpack changes (Merrill and Boyce 1991, 1996). Peak standing crop biomass on lower elevation winter ranges was less on grazed sites in one study in 1986, but no difference was detected in 1987, 1989, or 1990 (Singer 1996a, Singer and Harter 1996). Grassland production was stimulated by elk and bison grazing on a wide variety of sites and elevations (Frank 1990, Singer 1996a, Wallace 1996), except that production was not stimulated on some sites during the severe summer drought of 1988 (Frank and McNaughton 1992, Wallace 1996). Frank and McNaughton studied the interactive ecology of plants, large mammals, and drought on the northern range (Frank 1990; Frank and McNaughton 1991, 1992, 1993, 1996a, 1996b). They concluded that the park's ungulates, because of their high mobility and ability to make all their own decisions regarding forage choice, track young vegetation as it grows across the <strong>Yellowstone</strong> landscape. Elk and bison consumption rates of yearly grass production was found to be high, about 45 percent (Frank 1990). Peak consumption was linked to peak periods of plant growth. Nutrient cycling, that is, the return of minerals necessary for plant growth to the soil, occurred at a high rate on heavily grazed sites. Ungulates excrete 90 percent of the phosphorus they ingest, and 65-95 percent of their ingested nitrogen. By consuming and excreting plant matter at this scale, grazers stimulated aboveground production of their preferred food plants. This is a milestone scientific finding in <strong>Yellowstone</strong>, but it has been substantiated in other large wildland ranges, such as the African Serengeti. The discovery that grazers • stimulated aboveground production of their preferred plant foods dramatically reverses traditional views by demonstrating that not only do wild ungulates not harm the plants, they facilitate and enhance plant growth: In <strong>Yellowstone</strong>, herbivores stimulated production at sites that were explicitly selected at the beginning of the study for their high herbivore use. Moreover, stimulationoccurred in 1988 when elk and bison populations were at their highest levels in recent history. The only exception was the summer range site, mentioned above, where the drought was the severest and, notably, grazers had no effect on production. Some .. . have argued that the increase of northern range elk since <strong>Yellowstone</strong> Park's implementation of the "natural regulation" policy in 1969 ... has led to grassland deterioration in the northern range. These data clearly refute this argument by demonstrating no evidence for ecosystem process degradation, and show that quite the contrary, even during a year of unusually high elk and bison numbers, grazers stimulated grassland production in the northern range (Frank 1990). It should be pointed out that some livestock managers are now discovering similar responses to grazing. When these managers move dense herds of their stock in an attempt more nearly to mimic the concentrations and seasonal movements of wild ungUlates, they find that some plant species respond with vigorous growth (Dagget 1995). Timing of ungulate use of the northern range was another critical element in understanding grazing there. Frank (1990) determined that use of plants on the northern range is timed to allow the plants to sustain heavy use year after year. The elk follow the "growth pulse" of greenup as it moves from winter ranges to higher elevation summer ranges. Unlike fenced, penned, or even herded livestock, elk do not remain on any given range for long, but move as environmental conditions dictate. This means that they seldom graze winter
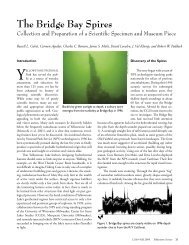
~ ,., ~ ,~ 100,000 10,000 GRASSLANDS 37 loge ;::;; 5 j'jj'j 2.04 (log NFP) - 4.80 5 ",' 1,000 * *
- Page 1: YELLOW"STONE'S NORTHERN RANGE COMPL
- Page 4 and 5: .. •.
- Page 6 and 7: Suggested citation: Yellowstone Nat
- Page 8 and 9: c=J Northern Winter Range _ Boundar
- Page 10 and 11: Aspen, willows, and biodiversity ..
- Page 12 and 13: vii
- Page 14 and 15: THE NORTHERN RANGE xii range criter
- Page 16 and 17: L ~I , }! \,.'1. J 4 f ; " IF , , 1
- Page 18 and 19: THE NORTHERN RANGE 2 Figure 1.1. Ph
- Page 20 and 21: THE NORTHERN RANGE tion. There was
- Page 22 and 23: THE NORTHERN RANGE 6 Figure 1.6. Gr
- Page 24 and 25: THE NORTHERN RANGE 8 Figure 1.8. El
- Page 26 and 27: THE NORTHERN RANGE 10 unpopular or
- Page 28 and 29: THE NORTHERN RANGE 12 earlier Yello
- Page 30 and 31: , ! ~ , I~ " 1 \, • .' '-, , \, ,
- Page 32 and 33: THE NORTHERN RANGE 16 Northern rang
- Page 34 and 35: Figure 2.3. Sum ot rotal annual riv
- Page 36 and 37: THE NORTHERN RANGE 20 Figure 2.4 Tr
- Page 38 and 39: THE NORTHERN RANGE 22 dendrochronol
- Page 40 and 41: THE NORTHERN RANGE 24 Figure 2.7. A
- Page 42 and 43: THE NORTHERN RANGE 26 et al. (1991)
- Page 44 and 45: THE NORTHERN RANGE 28 earlier time,
- Page 46 and 47: .', P (/ i0~ , • 9 ~ § , , ~ , i
- Page 48 and 49: THE NORTHERN RANGE 32 systems-range
- Page 50 and 51: THE NORTHERN RANGE 34 indicates the
- Page 54 and 55: THE NORTHERN RANGE 38 grazed and un
- Page 56 and 57: THE NORTHERN RANGE showed that graz
- Page 58 and 59: , ~ , • V , '. ~ ;' t ~ " ~ .' .~
- Page 60 and 61: Figure 4.1. Northern range, showing
- Page 62 and 63: Figure 4.2. Willow distribution in
- Page 64 and 65: THE NORTHERN RANGE 48 Figure 4.4. I
- Page 66 and 67: THE NORTHERN RANGE 50 public lands,
- Page 68 and 69: THE NORTIlERN RANGE 52 Figure 4.5.
- Page 70 and 71: THE NORTHERN RANGE 54 able uncertai
- Page 72 and 73: THE NORTHERN RANGE 56 to confirm an
- Page 74: THE NORTHERN RANGE 58 RESEARCH RECO
- Page 77 and 78: SOIL, EROSION, SEDIMENTS, AND WATER
- Page 79 and 80: SOIL, EROSION, SEDIMENTS, AND WATER
- Page 81 and 82: ated with ungulate winter ranges. T
- Page 83 and 84: ELK POPULATION ISSUES IS YELLOWSTON
- Page 85 and 86: ange grazing issue, Yellowstone man
- Page 87 and 88: ELK POPULATION ISSUES 71 ... Other
- Page 89 and 90: ELK POPULATION ISSUES 73 1996d), so
- Page 91 and 92: ELK POPULATION ISSUES 75 the northe
- Page 93 and 94: ELK POPULATION ISSUES 77 It has evo
- Page 96 and 97: 4 , ~ 1 v " 'It , \ J~ ~""~ .:,~ ",
- Page 98 and 99: THE NORTHERN RANGE 82 Competition t
- Page 100 and 101: Figure 7.3. Bison winter range. Sin
- Page 102 and 103:
THE NORTHERN RANGE Figure 7.7. Envi
- Page 104 and 105:
THE NORTHERN RANGE 88 not aware of
- Page 106 and 107:
THE NORTHERN RANGE 90 tion size, an
- Page 108 and 109:
THE NORTHERN RANGE 92 activity (95
- Page 110 and 111:
THE NORTHERN RANGE 94 pursue the su
- Page 112 and 113:
THE NORTHERN RANGE 96 factors were
- Page 114 and 115:
THE NORTHERN RANGE Figure 7.13. Num
- Page 116 and 117:
, .. , , " , ! I ." ~, ~ " ,.\ ,•
- Page 118 and 119:
THE NORTHERN RANGE 102 complex set
- Page 120 and 121:
THE NORTHERN RANGE 104 practically
- Page 122 and 123:
THE NORTHERN RANGE 106 appear suppr
- Page 124 and 125:
AppendixA. Conferences, Meetings, a
- Page 126 and 127:
lJO Year Estimate Comment Source 19
- Page 128 and 129:
lJ2 , Estimated # of Elk Year Date
- Page 130 and 131:
lJ4 Winter Total Count 1967-68 397
- Page 132 and 133:
116 Year Date of Count Parkwide Par
- Page 134 and 135:
118 Counts and estimates of mule de
- Page 136 and 137:
120 Northern Yellowstone winter ran
- Page 138 and 139:
122 Population estimates and reduct
- Page 140 and 141:
124 Actual count Inside Outside Est
- Page 142 and 143:
Pronghorn counted during spring sur
- Page 144 and 145:
128 Year 1939 1940 1941 1942 1943 1
- Page 146 and 147:
Ground and aerial counts of bighorn
- Page 148 and 149:
REFERENCE LIST NOTES ON THIS REFERE
- Page 150 and 151:
Pages 199-210 in Carbyn, L.N., S.H.
- Page 152 and 153:
Yellowstone National Park. Technica
- Page 154 and 155:
mammal mortality in the 1988 Yellow
- Page 156 and 157:
National Park. International Journa
- Page 158 and 159:
Mehus, C.A. 1995. Influences ofbraw
- Page 160 and 161:
__ , and __ . 1996a. Preburn root b
- Page 162 and 163:
Pages 127-138 in F.J. Singer, ed. E
- Page 164 and 165:
some northern Yellowstone elk. M.S.
- Page 166:
I I I I I