

Socio-Economic Impact of HIV and AIDS in Tamil nadu
Socio-Economic Impact of HIV and AIDS in Tamil nadu
Socio-Economic Impact of HIV and AIDS in Tamil nadu

Create successful ePaper yourself
Turn your PDF publications into a flip-book with our unique Google optimized e-Paper software.
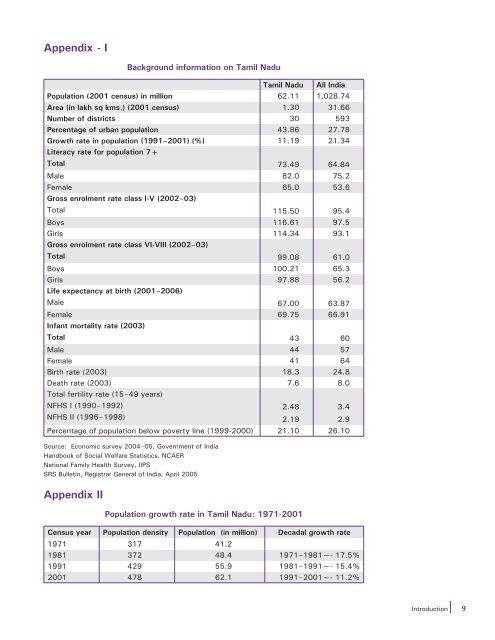
Appendix - I<br />
Appendix II<br />
Background <strong>in</strong>formation on <strong>Tamil</strong> Nadu<br />
<strong>Tamil</strong> Nadu All India<br />
Population (2001 census) <strong>in</strong> million 62.11 1,028.74<br />
Area (<strong>in</strong> lakh sq kms.) (2001 census) 1.30 31.66<br />
Number <strong>of</strong> districts 30 593<br />
Percentage <strong>of</strong> urban population 43.86 27.78<br />
Growth rate <strong>in</strong> population (1991–2001) (%) 11.19 21.34<br />
Literacy rate for population 7+<br />
Total 73.49 64.84<br />
Male 82.0 75.2<br />
Female 65.0 53.6<br />
Gross enrolment rate class I-V (2002–03)<br />
Total 115.50 95.4<br />
Boys 116.61 97.5<br />
Girls 114.34 93.1<br />
Gross enrolment rate class VI-VIII (2002–03)<br />
Total 99.08 61.0<br />
Boys 100.21 65.3<br />
Girls 97.88 56.2<br />
Life expectancy at birth (2001–2006)<br />
Male 67.00 63.87<br />
Female 69.75 66.91<br />
Infant mortality rate (2003)<br />
Total 43 60<br />
Male 44 57<br />
Female 41 64<br />
Birth rate (2003) 18.3 24.8<br />
Death rate (2003) 7.6 8.0<br />
Total fertility rate (15–49 years)<br />
NFHS I (1990–1992)<br />
NFHS II (1996–1998)<br />
2.48<br />
2.19<br />
Percentage <strong>of</strong> population below poverty l<strong>in</strong>e (1999-2000) 21.10 26.10<br />
Source: <strong>Economic</strong> survey 2004–05, Government <strong>of</strong> India<br />
H<strong>and</strong>book <strong>of</strong> Social Welfare Statistics, NCAER<br />
National Family Health Survey, IIPS<br />
SRS Bullet<strong>in</strong>, Registrar General <strong>of</strong> India, April 2005<br />
Population growth rate <strong>in</strong> <strong>Tamil</strong> Nadu: 1971-2001<br />
Census year Population density Population (<strong>in</strong> million) Decadal growth rate<br />
1971 317 41.2<br />
1981 372 48.4 1971–1981~- 17.5%<br />
1991 429 55.9 1981–1991~- 15.4%<br />
2001 478 62.1 1991–2001~- 11.2%<br />
3.4<br />
2.9<br />
Introduction 9


